24个版本 (12个稳定版)
| 1.6.2 | 2024年7月23日 |
|---|---|
| 1.4.0 | 2024年4月30日 |
| 1.0.0 | 2024年3月30日 |
| 0.8.0 | 2024年2月12日 |
| 0.1.1 | 2021年6月21日 |
#61 in 数学
每月下载量286
用于2个Crate(通过gemlab)
1.5MB
26K SLoC
Russell Stat - 统计计算和(工程)概率分布
该Crate是Russell - Rust科学库的一部分
内容
介绍
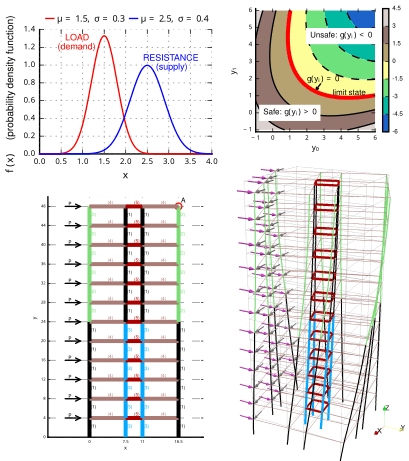
该库协助开发针对工程应用(如可靠性分析)的统计计算和模拟,并提供对rand_distr的轻量级接口以及额外功能。
该库中考虑的一些基本分布包括被分类为极值分布的分布。
下图展示了在结构安全中的应用(见参考文献#1),使用一阶可靠性模型(见参考文献#2)。

文档
参考文献
- Pedroso DM (2017) 使用并行进化算法进行FORM可靠性分析,结构安全,65:84-99
- Zhang et al. (2023) 岩土可靠性分析:理论、方法和算法,Springer,323页
安装
该Crate依赖于一些非Rust的高性能库。请参阅主README文件以了解安装这些依赖项的步骤。
设置Cargo.toml
👆 检查Crate版本并相应更新Cargo.toml
[dependencies]
russell_stat = "*"
可选功能
以下(Rust)功能可用
intel_mkl:使用Intel MKL而不是OpenBLAS
请注意,主README文件展示了根据每个功能编译所需库的步骤。
🌟 示例
本节说明了如何使用russell_stat。另请参阅
Frechet分布
use russell_stat::*;

fn main() -> Result<(), StrError> {
    // generate samples
    let mut rng = get_rng();
    let dist = DistributionFrechet::new(0.0, 1.0, 1.0)?;
    let nsamples = 10_000;
    let mut data = vec![0.0; nsamples];
    for i in 0..nsamples {
        data[i] = dist.sample(&mut rng);
    }
    println!("{}", statistics(&data));

    // text-plot
    let stations = (0..20).map(|i| (i as f64) * 0.5).collect::<Vec<f64>>();
    let mut hist = Histogram::new(&stations)?;
    hist.count(&data);
    println!("{}", hist);
    Ok(())
}
示例输出
min = 0.09073675834496424
max = 7694.599272007603
mean = 10.392955760859788
std_dev = 137.11729225249485

[  0,0.5) | 1407 🟦🟦🟦🟦🟦🟦🟦🟦🟦🟦🟦🟦🟦🟦🟦🟦🟦🟦
[0.5,  1) | 2335 🟦🟦🟦🟦🟦🟦🟦🟦🟦🟦🟦🟦🟦🟦🟦🟦🟦🟦🟦🟦🟦🟦🟦🟦🟦🟦🟦🟦🟦🟦
[  1,1.5) | 1468 🟦🟦🟦🟦🟦🟦🟦🟦🟦🟦🟦🟦🟦🟦🟦🟦🟦🟦
[1.5,  2) |  913 🟦🟦🟦🟦🟦🟦🟦🟦🟦🟦🟦
[  2,2.5) |  640 🟦🟦🟦🟦🟦🟦🟦🟦
[2.5,  3) |  420 🟦🟦🟦🟦🟦
[  3,3.5) |  358 🟦🟦🟦🟦
[3.5,  4) |  269 🟦🟦🟦
[  4,4.5) |  207 🟦🟦
[4.5,  5) |  185 🟦🟦
[  5,5.5) |  143 🟦
[5.5,  6) |  137 🟦
[  6,6.5) |   99 🟦
[6.5,  7) |   76
[  7,7.5) |   88 🟦
[7.5,  8) |   73
[  8,8.5) |   51
[8.5,  9) |   63
[  9,9.5) |   53
      sum = 8985
Gumbel分布
use russell_stat::*;

fn main() -> Result<(), StrError> {
    // generate samples
    let mut rng = get_rng();
    let dist = DistributionGumbel::new(0.5, 2.0)?;
    let nsamples = 10_000;
    let mut data = vec![0.0; nsamples];
    for i in 0..nsamples {
        data[i] = dist.sample(&mut rng);
    }
    println!("{}", statistics(&data));

    // text-plot
    let stations = (0..20).map(|i| -5.0 + (i as f64)).collect::<Vec<f64>>();
    let mut hist = Histogram::new(&stations)?;
    hist.set_bar_char('#').set_bar_max_len(40);
    hist.count(&data);
    println!("{}", hist);
    Ok(())
}
示例输出
min = -3.8702217016220706
max = 18.48991150178352
mean = 1.68369488450194
std_dev = 2.5805268053167527

[-5,-4) |    0
[-4,-3) |   38
[-3,-2) |  264 #####
[-2,-1) |  929 ###################
[-1, 0) | 1457 ###############################
[ 0, 1) | 1880 ########################################
[ 1, 2) | 1610 ##################################
[ 2, 3) | 1283 ###########################
[ 3, 4) |  910 ###################
[ 4, 5) |  604 ############
[ 5, 6) |  398 ########
[ 6, 7) |  226 ####
[ 7, 8) |  153 ###
[ 8, 9) |   96 ##
[ 9,10) |   57 #
[10,11) |   42
[11,12) |   22
[12,13) |    9
[13,14) |   14
    sum = 9992
正态分布
use russell_stat::*;

fn main() -> Result<(), StrError> {
    // generate samples
    let mut rng = get_rng();
    let dist = DistributionNormal::new(0.0, 1.0)?;
    let nsamples = 10_000;
    let mut data = vec![0.0; nsamples];
    for i in 0..nsamples {
        data[i] = dist.sample(&mut rng);
    }
    println!("{}", statistics(&data));

    // text-plot
    let stations = (0..20).map(|i| -4.0 + (i as f64) * 0.5).collect::<Vec<f64>>();
    let mut hist = Histogram::new(&stations)?;
    hist.set_bar_char('🍕').set_bar_max_len(30);
    hist.count(&data);
    println!("{:.2}", hist);
    Ok(())
}
示例输出
min = -3.466424128646902
max = 3.608012748101761
mean = 0.003299589990111208
std_dev = 0.9760553437435371

[-4.00,-3.50) |    0
[-3.50,-3.00) |   10
[-3.00,-2.50) |   41
[-2.50,-2.00) |  156 🍕🍕
[-2.00,-1.50) |  443 🍕🍕🍕🍕🍕🍕
[-1.50,-1.00) |  869 🍕🍕🍕🍕🍕🍕🍕🍕🍕🍕🍕🍕🍕
[-1.00,-0.50) | 1450 🍕🍕🍕🍕🍕🍕🍕🍕🍕🍕🍕🍕🍕🍕🍕🍕🍕🍕🍕🍕🍕
[-0.50, 0.00) | 1971 🍕🍕🍕🍕🍕🍕🍕🍕🍕🍕🍕🍕🍕🍕🍕🍕🍕🍕🍕🍕🍕🍕🍕🍕🍕🍕🍕🍕🍕
[ 0.00, 0.50) | 1996 🍕🍕🍕🍕🍕🍕🍕🍕🍕🍕🍕🍕🍕🍕🍕🍕🍕🍕🍕🍕🍕🍕🍕🍕🍕🍕🍕🍕🍕🍕
[ 0.50, 1.00) | 1499 🍕🍕🍕🍕🍕🍕🍕🍕🍕🍕🍕🍕🍕🍕🍕🍕🍕🍕🍕🍕🍕🍕
[ 1.00, 1.50) |  951 🍕🍕🍕🍕🍕🍕🍕🍕🍕🍕🍕🍕🍕🍕
[ 1.50, 2.00) |  419 🍕🍕🍕🍕🍕🍕
[ 2.00, 2.50) |  150 🍕🍕
[ 2.50, 3.00) |   34
[ 3.00, 3.50) |   10
[ 3.50, 4.00) |    1
[ 4.00, 4.50) |    0
[ 4.50, 5.00) |    0
[ 5.00, 5.50) |    0
         sum = 10000
对数正态分布
use russell_stat::*;

fn main() -> Result<(), StrError> {
    // generate samples
    let mut rng = get_rng();
    let dist = DistributionLognormal::new(0.0, 0.25)?;
    let nsamples = 10_000;
    let mut data = vec![0.0; nsamples];
    for i in 0..nsamples {
        data[i] = dist.sample(&mut rng);
    }
    println!("{}", statistics(&data));

    // text-plot
    let stations = (0..25).map(|i| (i as f64) * 0.1).collect::<Vec<f64>>();
    let mut hist = Histogram::new(&stations)?;
    hist.set_bar_char('✨').set_bar_max_len(30);
    hist.count(&data);
    println!("{:.2}", hist);
    Ok(())
}
示例输出
min = 0.42738183908592275
max = 2.5343346501352135
mean = 1.0330160154674082
std_dev = 0.2610005570820734

[0.00,0.10) |    0
[0.10,0.20) |    0
[0.20,0.30) |    0
[0.30,0.40) |    0
[0.40,0.50) |   33
[0.50,0.60) |  155 ✨✨
[0.60,0.70) |  558 ✨✨✨✨✨✨✨✨✨✨
[0.70,0.80) | 1092 ✨✨✨✨✨✨✨✨✨✨✨✨✨✨✨✨✨✨✨✨
[0.80,0.90) | 1494 ✨✨✨✨✨✨✨✨✨✨✨✨✨✨✨✨✨✨✨✨✨✨✨✨✨✨✨
[0.90,1.00) | 1622 ✨✨✨✨✨✨✨✨✨✨✨✨✨✨✨✨✨✨✨✨✨✨✨✨✨✨✨✨✨✨
[1.00,1.10) | 1509 ✨✨✨✨✨✨✨✨✨✨✨✨✨✨✨✨✨✨✨✨✨✨✨✨✨✨✨
[1.10,1.20) | 1275 ✨✨✨✨✨✨✨✨✨✨✨✨✨✨✨✨✨✨✨✨✨✨✨
[1.20,1.30) |  817 ✨✨✨✨✨✨✨✨✨✨✨✨✨✨✨
[1.30,1.40) |  552 ✨✨✨✨✨✨✨✨✨✨
[1.40,1.50) |  364 ✨✨✨✨✨✨
[1.50,1.60) |  202 ✨✨✨
[1.60,1.70) |  151 ✨✨
[1.70,1.80) |   77 ✨
[1.80,1.90) |   49
[1.90,2.00) |   21
[2.00,2.10) |   14
[2.10,2.20) |    7
[2.20,2.30) |    5
[2.30,2.40) |    0
        sum = 9997
均匀分布
use russell_stat::*;

fn main() -> Result<(), StrError> {
    // generate samples
    let mut rng = get_rng();
    let dist = DistributionUniform::new(-10.0, 10.0)?;
    let nsamples = 10_000;
    let mut data = vec![0.0; nsamples];
    for i in 0..nsamples {
        data[i] = dist.sample(&mut rng);
    }
    println!("{}", statistics(&data));

    // text-plot
    let stations = (0..21).map(|i| -10.0 + (i as f64)).collect::<Vec<f64>>();
    let mut hist = Histogram::new(&stations)?;
    hist.set_bar_char('🟪').set_bar_max_len(30);
    hist.count(&data);
    println!("{:.2}", hist);
    Ok(())
}
示例输出
min = -9.995565022955866
max = 9.997897516369218
mean = 0.006907240624592568
std_dev = 5.761189943810604

[-10.00, -9.00) | 488 🟪🟪🟪🟪🟪🟪🟪🟪🟪🟪🟪🟪🟪🟪🟪🟪🟪🟪🟪🟪🟪🟪🟪🟪🟪🟪🟪
[ -9.00, -8.00) | 488 🟪🟪🟪🟪🟪🟪🟪🟪🟪🟪🟪🟪🟪🟪🟪🟪🟪🟪🟪🟪🟪🟪🟪🟪🟪🟪🟪
[ -8.00, -7.00) | 490 🟪🟪🟪🟪🟪🟪🟪🟪🟪🟪🟪🟪🟪🟪🟪🟪🟪🟪🟪🟪🟪🟪🟪🟪🟪🟪🟪
[ -7.00, -6.00) | 537 🟪🟪🟪🟪🟪🟪🟪🟪🟪🟪🟪🟪🟪🟪🟪🟪🟪🟪🟪🟪🟪🟪🟪🟪🟪🟪🟪🟪🟪
[ -6.00, -5.00) | 503 🟪🟪🟪🟪🟪🟪🟪🟪🟪🟪🟪🟪🟪🟪🟪🟪🟪🟪🟪🟪🟪🟪🟪🟪🟪🟪🟪🟪
[ -5.00, -4.00) | 510 🟪🟪🟪🟪🟪🟪🟪🟪🟪🟪🟪🟪🟪🟪🟪🟪🟪🟪🟪🟪🟪🟪🟪🟪🟪🟪🟪🟪
[ -4.00, -3.00) | 487 🟪🟪🟪🟪🟪🟪🟪🟪🟪🟪🟪🟪🟪🟪🟪🟪🟪🟪🟪🟪🟪🟪🟪🟪🟪🟪🟪
[ -3.00, -2.00) | 453 🟪🟪🟪🟪🟪🟪🟪🟪🟪🟪🟪🟪🟪🟪🟪🟪🟪🟪🟪🟪🟪🟪🟪🟪🟪
[ -2.00, -1.00) | 537 🟪🟪🟪🟪🟪🟪🟪🟪🟪🟪🟪🟪🟪🟪🟪🟪🟪🟪🟪🟪🟪🟪🟪🟪🟪🟪🟪🟪🟪
[ -1.00,  0.00) | 518 🟪🟪🟪🟪🟪🟪🟪🟪🟪🟪🟪🟪🟪🟪🟪🟪🟪🟪🟪🟪🟪🟪🟪🟪🟪🟪🟪🟪
[  0.00,  1.00) | 499 🟪🟪🟪🟪🟪🟪🟪🟪🟪🟪🟪🟪🟪🟪🟪🟪🟪🟪🟪🟪🟪🟪🟪🟪🟪🟪🟪
[  1.00,  2.00) | 496 🟪🟪🟪🟪🟪🟪🟪🟪🟪🟪🟪🟪🟪🟪🟪🟪🟪🟪🟪🟪🟪🟪🟪🟪🟪🟪🟪
[  2.00,  3.00) | 466 🟪🟪🟪🟪🟪🟪🟪🟪🟪🟪🟪🟪🟪🟪🟪🟪🟪🟪🟪🟪🟪🟪🟪🟪🟪🟪
[  3.00,  4.00) | 521 🟪🟪🟪🟪🟪🟪🟪🟪🟪🟪🟪🟪🟪🟪🟪🟪🟪🟪🟪🟪🟪🟪🟪🟪🟪🟪🟪🟪🟪
[  4.00,  5.00) | 490 🟪🟪🟪🟪🟪🟪🟪🟪🟪🟪🟪🟪🟪🟪🟪🟪🟪🟪🟪🟪🟪🟪🟪🟪🟪🟪🟪
[  5.00,  6.00) | 498 🟪🟪🟪🟪🟪🟪🟪🟪🟪🟪🟪🟪🟪🟪🟪🟪🟪🟪🟪🟪🟪🟪🟪🟪🟪🟪🟪
[  6.00,  7.00) | 518 🟪🟪🟪🟪🟪🟪🟪🟪🟪🟪🟪🟪🟪🟪🟪🟪🟪🟪🟪🟪🟪🟪🟪🟪🟪🟪🟪🟪
[  7.00,  8.00) | 513 🟪🟪🟪🟪🟪🟪🟪🟪🟪🟪🟪🟪🟪🟪🟪🟪🟪🟪🟪🟪🟪🟪🟪🟪🟪🟪🟪🟪
[  8.00,  9.00) | 535 🟪🟪🟪🟪🟪🟪🟪🟪🟪🟪🟪🟪🟪🟪🟪🟪🟪🟪🟪🟪🟪🟪🟪🟪🟪🟪🟪🟪🟪
[  9.00, 10.00) | 453 🟪🟪🟪🟪🟪🟪🟪🟪🟪🟪🟪🟪🟪🟪🟪🟪🟪🟪🟪🟪🟪🟪🟪🟪🟪
          sum = 10000