33个版本 (11个稳定版)
| 新 1.7.0 | 2024年8月24日 |
|---|---|
| 1.2.1 | 2024年7月31日 |
| 0.7.0 | 2024年6月3日 |
| 0.6.1 | 2024年3月23日 |
| 0.2.4 | 2021年10月13日 |
#67 in 数学
每月下载量 1,245
被 12 crate 使用
640KB
6K SLoC
使用Python(Matplotlib)的Rust绘图库
内容
简介
此crate实现了生成绘图和绘制的函数。虽然我们使用Python/Matplotlib,但目标是提供一个方便的Rust库,它不同于Matplotlib。这种差异是因为我们希望为Rust开发者提供便利,同时获得Matplotlib的出色质量 😊。
Plotpy比Matplotlib更详细,因为我们旨在通过利用IDE(例如VS Code)的自动补全功能来最小化记住功能的需求。
内部,我们通过Python 3脚本使用Matplotlib。首先,我们在你选择的目录中生成一个Python代码(例如,/tmp/plotpy),然后使用Rust的std::process::Command调用python3。
有关更多信息(和示例),请参阅docs.rs上的plotpy文档。
安装
此代码主要在Debian/Ubuntu/Linux上进行测试。
当然,此crate需要Python3和Matplotlib。
在Debian/Ubuntu/Linux上运行
sudo apt install python3-matplotlib
重要:Rust代码将通过python3通过std::process::Command调用。但是,有一个选项可以调用不同的Python可执行文件;例如(下面的代码未经测试)
let mut plot = Plot::new();
plot.set_python_exe("C:\Windows11\WhereIs\python.exe")
    .add(...)
    .save(...)?;
设置Cargo.toml
👆 检查crate版本并相应地更新Cargo.toml
[dependencies]
plotpy = "*"
使用evcxr通过Jupyter
Plotpy可以通过evcxr与Jupyter一起使用。因此,它可以在Jupyter Notebook中交互式地显示图形。此功能需要安装evcxr。请参阅Jupyter/evcxr文章。
以下代码显示了一个最小示例(未经测试)
// set the python path
let python = "where-is-my/python";

// set the figure path and name to be saved
let path = "my-figure.svg";

// plot and show in a Jupyter notebook
let mut plot = Plot::new();
plot.set_python_exe(python)
    .set_label_x("x")
    .set_label_y("y")
    .show_in_jupyter(path)?;
示例
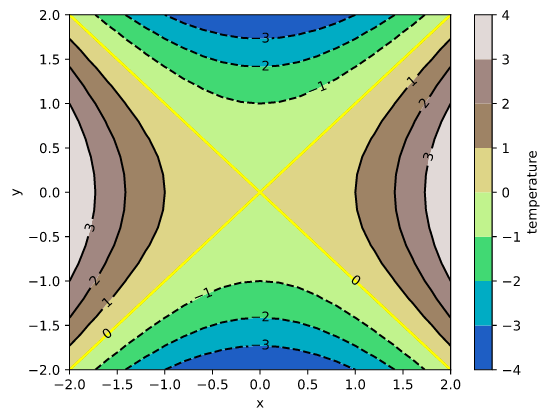
等高线
use plotpy::{generate3d, Contour, Plot, StrError};

fn main() -> Result<(), StrError> {
    // generate (x,y,z) matrices
    let n = 21;
    let (x, y, z) = generate3d(-2.0, 2.0, -2.0, 2.0, n, n, |x, y| x * x - y * y);

    // configure contour
    let mut contour = Contour::new();
    contour
        .set_colorbar_label("temperature")
        .set_colormap_name("terrain")
        .set_selected_level(0.0, true);

    // draw contour
    contour.draw(&x, &y, &z);

    // add contour to plot
    let mut plot = Plot::new();
    plot.add(&contour);
    plot.set_labels("x", "y");

    // save figure
    plot.save("/tmp/plotpy/readme_contour.svg")?;
    Ok(())
}
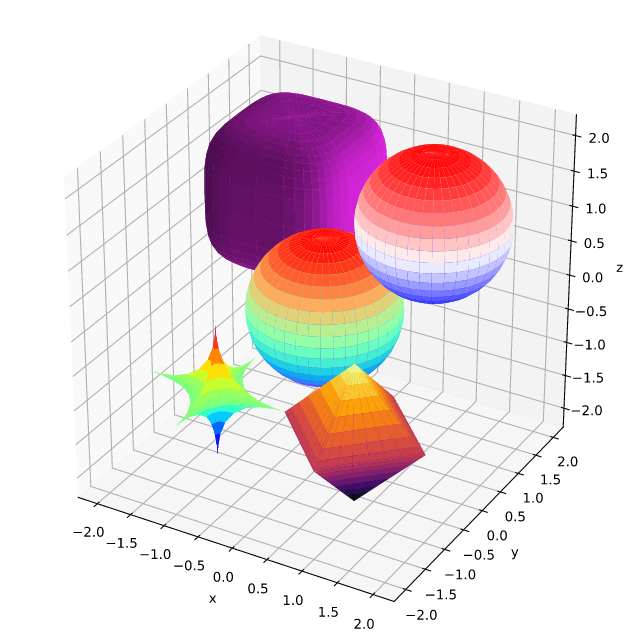
超二次曲面
use plotpy::{Plot, StrError, Surface};

fn main() -> Result<(), StrError> {
    // star
    let r = &[1.0, 1.0, 1.0];
    let c = &[-1.0, -1.0, -1.0];
    let k = &[0.5, 0.5, 0.5];
    let mut star = Surface::new();
    star.set_colormap_name("jet")
        .draw_superquadric(c, r, k, -180.0, 180.0, -90.0, 90.0, 40, 20)?;

    // pyramids
    let c = &[1.0, -1.0, -1.0];
    let k = &[1.0, 1.0, 1.0];
    let mut pyramids = Surface::new();
    pyramids
        .set_colormap_name("inferno")
        .draw_superquadric(c, r, k, -180.0, 180.0, -90.0, 90.0, 40, 20)?;

    // rounded cube
    let c = &[-1.0, 1.0, 1.0];
    let k = &[4.0, 4.0, 4.0];
    let mut cube = Surface::new();
    cube.set_surf_color("#ee29f2")
        .draw_superquadric(c, r, k, -180.0, 180.0, -90.0, 90.0, 40, 20)?;

    // sphere
    let c = &[0.0, 0.0, 0.0];
    let k = &[2.0, 2.0, 2.0];
    let mut sphere = Surface::new();
    sphere
        .set_colormap_name("rainbow")
        .draw_superquadric(c, r, k, -180.0, 180.0, -90.0, 90.0, 40, 20)?;

    // sphere (direct)
    let mut sphere_direct = Surface::new();
    sphere_direct.draw_sphere(&[1.0, 1.0, 1.0], 1.0, 40, 20)?;

    // add features to plot
    let mut plot = Plot::new();
    plot.add(&star)
        .add(&pyramids)
        .add(&cube)
        .add(&sphere)
        .add(&sphere_direct);

    // save figure
    plot.set_equal_axes(true)
        .set_figure_size_points(600.0, 600.0)
        .save("/tmp/plotpy/readme_superquadric.svg")?;
    Ok(())
}

