2 个版本
| 0.1.1 | 2022 年 12 月 30 日 |
|---|---|
| 0.1.0 | 2022 年 12 月 30 日 |
#172 in 可视化
每月 104 次下载
在 2 crates 中使用
215KB
421 行
termplot
适用于 CLI 应用的 可扩展 绘图库。

文档
在 doc.rs 上查找完整文档
快速入门
要使用 termplot,请将 crate 添加到您的 Cargo.toml。
[dependencies]
termplot = "0.1.0"
示例
绘制函数
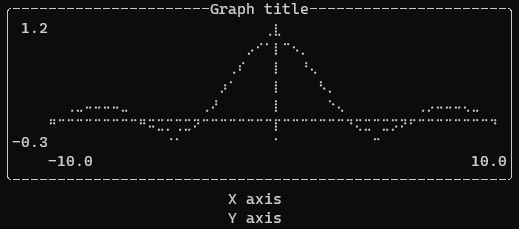
以下是一个绘制 sin(x) / x 的示例。
use termplot::*;

let mut plot = Plot::default();
plot.set_domain(Domain(-10.0..10.0))
    .set_codomain(Domain(-0.3..1.2))
    .set_title("Graph title")
    .set_x_label("X axis")
    .set_y_label("Y axis")
    .set_size(Size::new(50, 25))
    .add_plot(Box::new(plot::Graph::new(|x| x.sin() / x)));

println!("{plot}");
上一个示例的输出

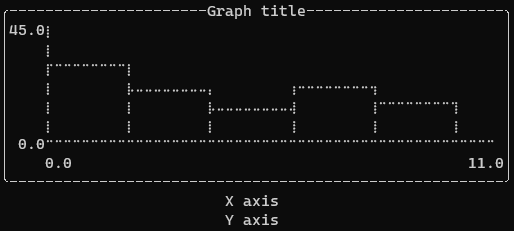
直方图
use termplot::*;
use rand::Rng;

let mut rng = rand::thread_rng();
let values: Vec<f64> = (0..100).map(|_| rng.gen_range(0.0f64..10.0f64)).collect();

let mut plot = Plot::default();

plot.set_domain(Domain(0.0..11.0))
    .set_codomain(Domain(0.0..45.0))
    .set_title("Graph title")
    .set_x_label("X axis")
    .set_y_label("Y axis")
    .set_size(Size::new(50, 25))
    .add_plot(Box::new(plot::Historigram::new(
        values,
        vec![0.0..2.0, 2.0..4.0, 4.0..6.0, 6.0..8.0, 8.0..10.0],
    )));

println!("{plot}");
上一个示例的输出

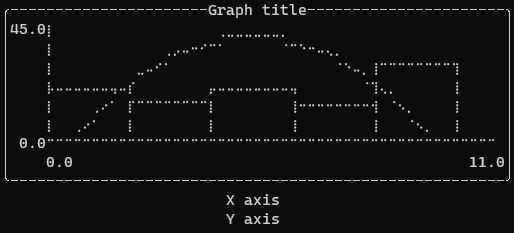
组合多个绘图
也可以组合多个绘图
use termplot::*;
use rand::Rng;

let mut rng = rand::thread_rng();
let values: Vec<f64> = (0..100).map(|_| rng.gen_range(0.0f64..10.0f64)).collect();

let mut plot = Plot::default();

plot.set_domain(Domain(0.0..11.0))
    .set_codomain(Domain(0.0..45.0))
    .set_title("Graph title")
    .set_x_label("X axis")
    .set_y_label("Y axis")
    .set_size(Size::new(50, 25))
    .add_plot(Box::new(plot::Historigram::new(
        values,
        vec![0.0..2.0, 2.0..4.0, 4.0..6.0, 6.0..8.0, 8.0..10.0],
    )))
    .add_plot(Box::new(plot::Graph::new(|x| {
        -2.0 * (x - 5.0).powf(2.0) + 40.0
    })));

println!("{plot}");
上一个示例的输出

许可协议
MIT - 请享用!
依赖
~0.1–10MB
~54K SLoC