3 个版本
| 0.1.2 | 2022年9月11日 |
|---|---|
| 0.1.1 | 2022年9月9日 |
| 0.1.0 | 2022年9月9日 |
#341 in 可视化
74 每月下载量
195KB
simple-plot
![]()
![]()
![]()
提供了一个宏 `plot!()`,它使用 Plotly 绘制一维向量 (impl IntoIterator<Item={number}>)。
无需复杂设置;只需将图表标题和要绘制的向量传递给 `plot!()`,图表就会显示出来。
传递的向量以索引在 x 轴上,以元素值在 y 轴上绘制。
用法/示例
在 Cargo.toml 中
[dependencies]
simple-plot = "0.1.0"
let range = 0..100;
let sin_iter = (0..150).map(|x| (x as f32 / 10.0).sin() * 20.0);
let parabola_vec:Vec<i32> = (-10..10).map(|x| x*x - 30).collect();
let cos_vec: Vec<f32> = (0..150).map(|x| (x as f32 / 20.0).cos() * 10.0).collect();
let cos_slcie: &[f32] = &cos_vec;

simple_plot::plot!("title", range, sin_iter, parabola_vec, cos_slcie);
结果 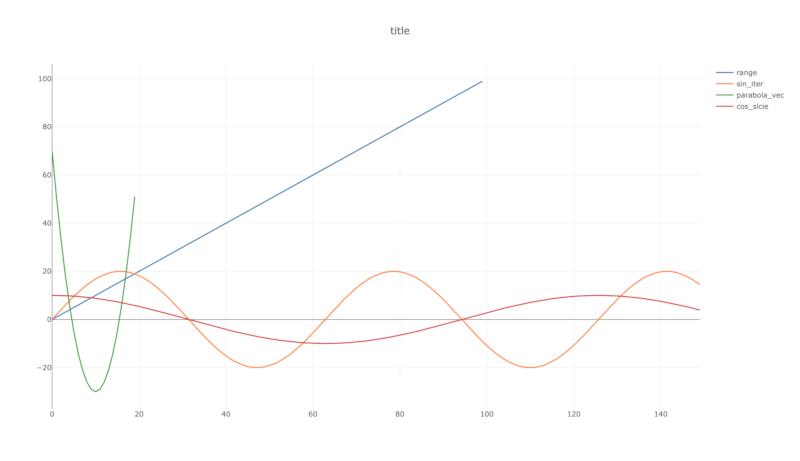
此库无法做到的
- 更改 x 轴的值
- 更改图表颜色等。
如果您需要这些功能,请使用 plotly
依赖项
~9MB
~116K SLoC