3 个版本 (破坏性更新)
| 0.3.0 | 2020年4月24日 |
|---|---|
| 0.2.0 | 2020年4月3日 |
| 0.1.0 | 2020年3月31日 |
135 在 可视化 中排名
每月下载量 402
用于 vim-profiler
380KB
2.5K SLoC
charts
受 D3.js 启发的纯 Rust 可视化库。
安装
您可以将此作为依赖项添加到您的 Cargo.toml 文件中
[dependencies]
charts = "0.3.0"
图表类型
该库支持以下图表(更多即将添加)
- 垂直柱状图
- 垂直堆积柱状图
- 水平柱状图
- 水平堆积柱状图
- 散点图
- 折线图
- 面积图
- 直方图(待定)
- 箱线图(待定)
- 其他(待定)
此外,还支持 组合图表(见以下组合图表)
构建块
以下是您创建图表所需的组件
- 刻度
- 视图
- 坐标轴
- 大小和边距
- 图例
前两个是基础组件,提供了在数据表示方式和组合数据以实现所需结果方面的灵活性,而目标是超越简单形式的数据可视化。
让我们深入了解每个构建块并定义其结构和 API,或者您可以直接前往示例部分,看看您可以使用 charts 建立什么。
1. 刻度
刻度是一个将数据从一维转换到另一维的实体。您正在转换的维度称为 域,您正在转换到的维度称为 范围。目前,charts 实现了两种类型的刻度
- 线性刻度
- 带状刻度
线性刻度
线性刻度是一个插值函数,它接受一个域(例如 [0, 10])和一个范围(例如 [0, 50]),并能够将域中的一个值转换到对应范围中的一个值(例如 5 -> 25)。
在使用线性刻度创建图表时,域代表数据集中存在的值范围。例如,如果您有一个简单的数据集vec![123, 48, 232, 99],域表示为[48, 232](但它也可以表示为[40, 240]或[0, 1000],稍后将有更多介绍)。
相反,刻度的范围代表可渲染的音域。例如,如果您有一个宽度为800px,左右各有50px边距的图表(见下文边距),这意味着可渲染数据的可用范围为[0, 700]。
因此,如果结合域和范围的概念,一个具有domain[0, 10]和range[0, 500]的刻度,将所有从0到10的点映射到0到500像素的范围内。
带状刻度
带状刻度接受一组不同的域值(例如,类别、年份)和一个连续的范围,并将域插值到范围中。它常用于条形图,其中需要将分类数据集映射到特定大小的连续轴。
例如,具有domain["苹果", "橙子", "梨"]和range[0, 100]的带状刻度将"苹果"域映射到0,"橙子"映射到33.33,"梨"映射到66.66。实际实现有一个inner_padding值,将在类别之间留下间隔,因此实际映射的值将略有不同。
2. 视图
由于相同的数据集可以以不同的形式表示,因此存在一个表示数据的特定表示的视图概念。
由于数据视图是在两个维度(在2D图表中)上的数据表示,因此每个视图都需要为其X轴和Y轴指定一个比例。
以下是可用的视图列表
- VerticalBarView
- HorizontalBarView
- ScatterView
- LineSeriesView
- AreaSeriesView
3. 轴
轴是可视化域范围的表示。这意味着为了正确显示轴,它应该与视图相同的比例一起操作。
作为用户,您不会明确创建轴,而是确定轴的位置(顶部、右侧、底部、左侧)以及该轴使用哪个比例。
4. 大小和边距
在创建图表时,您可以对其进行一定程度的外观定制。
您可以为图表设置宽度和高度以及边距(顶部、右侧、底部、左侧)。图表边距是图表边框的填充,定义了留给轴和其他与数据视图无关的元素的空间量。
例如,宽度为800px、高度为600px且边距为top: 100, right:40, bottom:50, left:60的图表将为实际数据表示留出700px宽、450px高的区域。
      width - 800
+-------------------------------------------------------+
|                        top                            |  h
|                        100                            |  e
|     +-------------------------------------------+     |  i
|     |                                           |     |  g
|left |                  Actual                   |right|  h
| 60  |                   Data                    | 40  |  t
|     |                   View                    |     |
|     |                700 x 450                  |     |  6
|     |                                           |     |  0
|     |                                           |     |  0
|     +-------------------------------------------+     |
|                      bottom - 50                      |
+-------------------------------------------------------+
5. 图例
图例会自动填充到图表中每个视图所包含的条目。要向图表添加图例,请在图表实例上使用add_legend_at(position: AxisPosition)方法(不要忘记在底部留出足够的边距以显示图例)。
数据集的key值用作图例条目标签。如果数据集没有键值(即当数据集表示单一类型的数据时),您可以通过View的set_custom_data_label(label: String)方法指定自定义标签。查看图表组成部分中散点图与两个数据集的示例。
示例
以下是一些当前支持的图表示例。
垂直柱状图
以下是示例代码
use charts::{Chart, VerticalBarView, ScaleBand, ScaleLinear};

fn main() {
    // Define chart related sizes.
    let width = 800;
    let height = 600;
    let (top, right, bottom, left) = (90, 40, 50, 60);

    // Create a band scale that maps ["A", "B", "C"] categories to values in the [0, availableWidth]
    // range (the width of the chart without the margins).
    let x = ScaleBand::new()
        .set_domain(vec![String::from("A"), String::from("B"), String::from("C")])
        .set_range(vec![0, width - left - right])
        .set_inner_padding(0.1)
        .set_outer_padding(0.1);

    // Create a linear scale that will interpolate values in [0, 100] range to corresponding
    // values in [availableHeight, 0] range (the height of the chart without the margins).
    // The [availableHeight, 0] range is inverted because SVGs coordinate system's origin is
    // in top left corner, while chart's origin is in bottom left corner, hence we need to invert
    // the range on Y axis for the chart to display as though its origin is at bottom left.
    let y = ScaleLinear::new()
        .set_domain(vec![0, 100])
        .set_range(vec![height - top - bottom, 0]);

    // You can use your own iterable as data as long as its items implement the `BarDatum` trait.
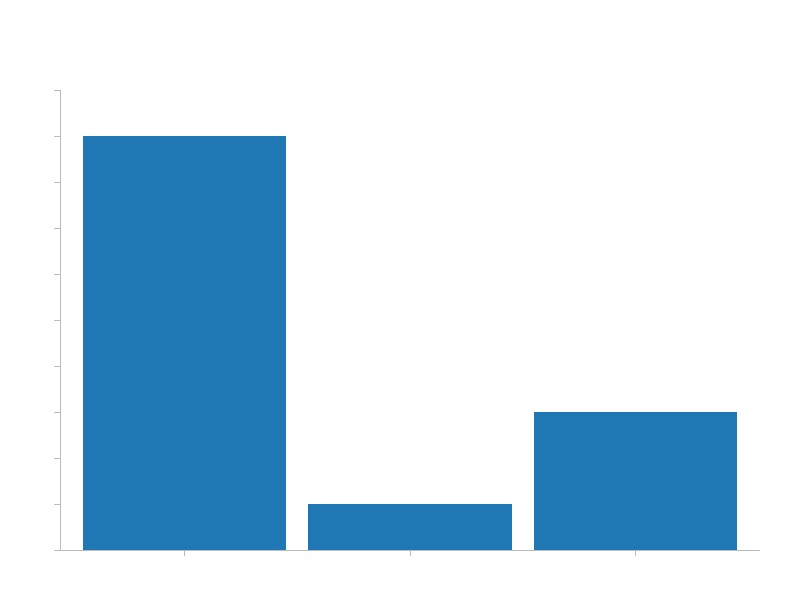
    let data = vec![("A", 90), ("B", 10), ("C", 30)];

    // Create VerticalBar view that is going to represent the data as vertical bars.
    let view = VerticalBarView::new()
        .set_x_scale(&x)
        .set_y_scale(&y)
        .load_data(&data).unwrap();

    // Generate and save the chart.
    Chart::new()
        .set_width(width)
        .set_height(height)
        .set_margins(top, right, bottom, left)
        .add_title(String::from("Bar Chart"))
        .add_view(&view)
        .add_axis_bottom(&x)
        .add_axis_left(&y)
        .add_left_axis_label("Units of Measurement")
        .add_bottom_axis_label("Categories")
        .save("vertical-bar-chart.svg").unwrap();
}
以下是结果
类别显示顺序由传递给set_domain方法的向量定义。如果您将此顺序更改为"A, C, B",则结果顺序也会相应调整。
您可以通过调整set_inner_padding和set_outer_padding的值来自定义图表的外观。
垂直堆积柱状图
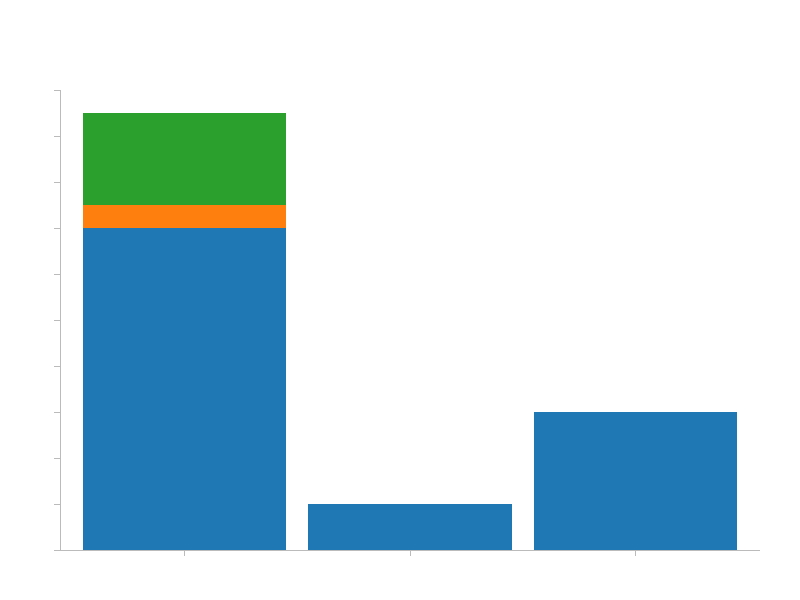
简单的柱状图(如上面所示)是堆叠柱状图的一个特例,其中只有一个值类型。在底层,charts对这两种类型处理得几乎一样,这就是为什么代码几乎相同,唯一的区别是输入数据必须提供一个key,以便按此键分组和堆叠值。
use charts::{Chart, VerticalBarView, ScaleBand, ScaleLinear, BarLabelPosition};

fn main() {
    // Define chart related sizes.
    let width = 800;
    let height = 600;
    let (top, right, bottom, left) = (90, 40, 50, 60);

    // Create a band scale that maps ["A", "B", "C"] categories to values in [0, availableWidth]
    // range (the width of the chart without the margins).
    let x = ScaleBand::new()
        .set_domain(vec![String::from("A"), String::from("B"), String::from("C")])
        .set_range(vec![0, width - left - right]);

    // Create a linear scale that will interpolate values in [0, 100] range to corresponding
    // values in [availableHeight, 0] range (the height of the chart without the margins).
    // The [availableHeight, 0] range is inverted because SVGs coordinate system's origin is
    // in the top left corner, while chart's origin is in bottom left corner, hence we need to
    // invert the range on Y axis for the chart to display as though its origin is at bottom left.
    let y = ScaleLinear::new()
        .set_domain(vec![0, 100])
        .set_range(vec![height - top - bottom, 0]);

    // You can use your own iterable as data as long as its items implement the `BarDatum` trait.
    let data = vec![("A", 70, "foo"), ("B", 10, "foo"), ("C", 30, "foo"), ("A", 20, "bar"), ("A", 5, "baz")];

    // Create VerticalBar view that is going to represent the data as vertical bars.
    let view = VerticalBarView::new()
        .set_x_scale(&x)
        .set_y_scale(&y)
        // .set_label_visibility(false)  // <-- uncomment this line to hide bar value labels
        .set_label_position(BarLabelPosition::Center)
        .load_data(&data).unwrap();

    // Generate and save the chart.
    Chart::new()
        .set_width(width)
        .set_height(height)
        .set_margins(top, right, bottom, left)
        .add_title(String::from("Stacked Bar Chart"))
        .add_view(&view)
        .add_axis_bottom(&x)
        .add_axis_left(&y)
        .add_left_axis_label("Units of Measurement")
        .add_bottom_axis_label("Categories")
        .save("stacked-vertical-bar-chart.svg").unwrap();
}
结果
默认情况下,输入数据中键的顺序决定了堆叠顺序。然而,您可以通过在调用 load_data() 方法之前,在 VerticalBarDataset 结构体上指定不同的顺序来调整它,使用 set_keys() 方法。
// Create VerticalBar view that is going to represent the data as vertical bars.
let view = VerticalBarView::new()
    .set_x_scale(&x)
    .set_y_scale(&y)
    .set_keys(vec![String::from("foo"), String::from("baz"), String::from("bar")])
    // .set_label_visibility(false)  // <-- uncomment this line to hide bar value labels
    .set_label_position(BarLabelPosition::Center)
    .load_data(&data).unwrap();
结果是如下所示(注意第一个柱状图中顺序的变化)
散点图
use charts::{Chart, ScaleLinear, ScatterView, MarkerType, PointLabelPosition};

fn main() {
    // Define chart related sizes.
    let width = 800;
    let height = 600;
    let (top, right, bottom, left) = (90, 40, 50, 60);

    // Create a band scale that will interpolate values in [0, 200] to values in the
    // [0, availableWidth] range (the width of the chart without the margins).
    let x = ScaleLinear::new()
        .set_domain(vec![0, 200])
        .set_range(vec![0, width - left - right]);

    // Create a linear scale that will interpolate values in [0, 100] range to corresponding
    // values in [availableHeight, 0] range (the height of the chart without the margins).
    // The [availableHeight, 0] range is inverted because SVGs coordinate system's origin is
    // in top left corner, while chart's origin is in bottom left corner, hence we need to invert
    // the range on Y axis for the chart to display as though its origin is at bottom left.
    let y = ScaleLinear::new()
        .set_domain(vec![0, 100])
        .set_range(vec![height - top - bottom, 0]);

    // You can use your own iterable as data as long as its items implement the `PointDatum` trait.
    let scatter_data = vec![(120, 90), (12, 54), (100, 40), (180, 10)];

    // Create Scatter view that is going to represent the data as points.
    let scatter_view = ScatterView::new()
        .set_x_scale(&x)
        .set_y_scale(&y)
        .set_label_position(PointLabelPosition::E)
        .set_marker_type(MarkerType::Square)
        .load_data(&scatter_data).unwrap();

    // Generate and save the chart.
    Chart::new()
        .set_width(width)
        .set_height(height)
        .set_margins(top, right, bottom, left)
        .add_title(String::from("Scatter Chart"))
        .add_view(&scatter_view)
        .add_axis_bottom(&x)
        .add_axis_left(&y)
        .add_left_axis_label("Custom X Axis Label")
        .add_bottom_axis_label("Custom Y Axis Label")
        .save("scatter-chart.svg").unwrap();
}
结果
您可以按照以下方式自定义外观和布局
选择标签相对于标记的显示方式。可用选项:N, NE, E, SE, S, SW, W, NW
选择点的标记类型。可用选项:方形,圆形,X
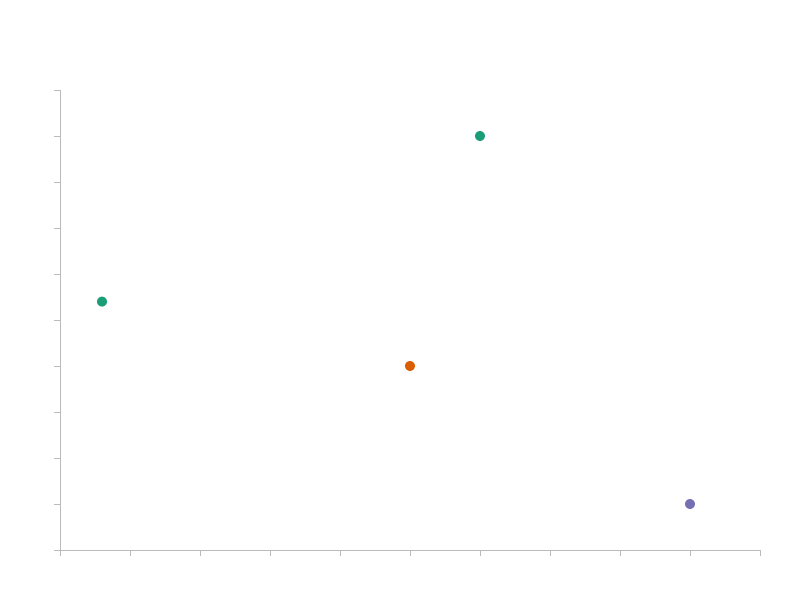
如果数据集有一个区分点的 key,您还可以使用 ScatterView 来显示它。
use charts::{Chart, ScaleLinear, ScatterView, MarkerType, Color, PointLabelPosition};

fn main() {
    // Define chart related sizes.
    let width = 800;
    let height = 600;
    let (top, right, bottom, left) = (90, 40, 50, 60);

    // Create a band scale that will interpolate values in [0, 200] to values in the
    // [0, availableWidth] range (the width of the chart without the margins).
    let x = ScaleLinear::new()
        .set_domain(vec![0, 200])
        .set_range(vec![0, width - left - right]);

    // Create a linear scale that will interpolate values in [0, 100] range to corresponding
    // values in [availableHeight, 0] range (the height of the chart without the margins).
    // The [availableHeight, 0] range is inverted because SVGs coordinate system's origin is
    // in top left corner, while chart's origin is in bottom left corner, hence we need to invert
    // the range on Y axis for the chart to display as though its origin is at bottom left.
    let y = ScaleLinear::new()
        .set_domain(vec![0, 100])
        .set_range(vec![height - top - bottom, 0]);

    // You can use your own iterable as data as long as its items implement the `PointDatum` trait.
    let scatter_data = vec![(120, 90, "foo"), (12, 54, "foo"), (100, 40, "bar"), (180, 10, "baz")];

    // Create Scatter view that is going to represent the data as points.
    let scatter_view = ScatterView::new()
        .set_x_scale(&x)
        .set_y_scale(&y)
        .set_label_position(PointLabelPosition::E)
        .set_marker_type(MarkerType::Circle)
        .set_colors(Color::color_scheme_dark())
        .load_data(&scatter_data).unwrap();

    // Generate and save the chart.
    Chart::new()
        .set_width(width)
        .set_height(height)
        .set_margins(top, right, bottom, left)
        .add_title(String::from("Scatter Chart"))
        .add_view(&scatter_view)
        .add_axis_bottom(&x)
        .add_axis_left(&y)
        .add_left_axis_label("Custom X Axis Label")
        .add_bottom_axis_label("Custom Y Axis Label")
        .save("scatter-chart-multiple-keys.svg").unwrap();
}
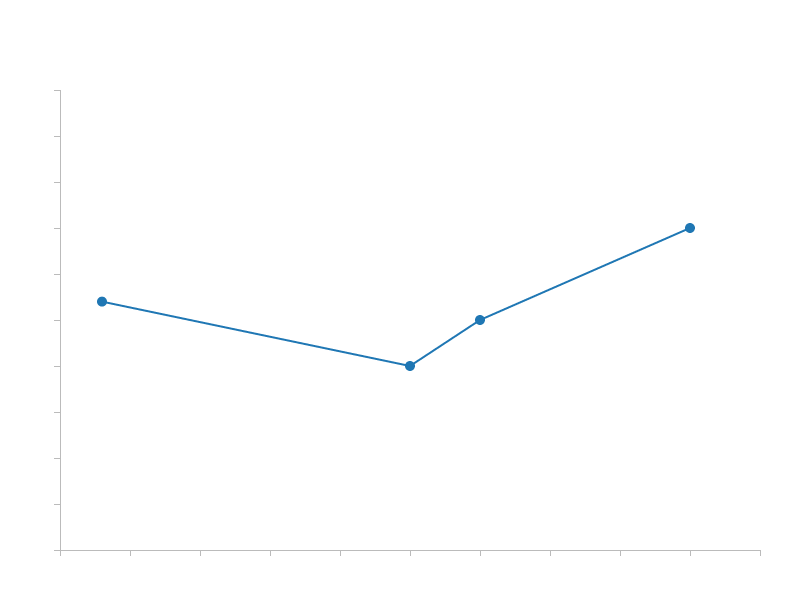
线系列
线系列支持散点图相同的函数。
use charts::{Chart, ScaleLinear, MarkerType, PointLabelPosition, LineSeriesView};

fn main() {
    // Define chart related sizes.
    let width = 800;
    let height = 600;
    let (top, right, bottom, left) = (90, 40, 50, 60);

    // Create a band scale that will interpolate values in [0, 200] to values in the
    // [0, availableWidth] range (the width of the chart without the margins).
    let x = ScaleLinear::new()
        .set_domain(vec![0_f32, 200_f32])
        .set_range(vec![0, width - left - right]);

    // Create a linear scale that will interpolate values in [0, 100] range to corresponding
    // values in [availableHeight, 0] range (the height of the chart without the margins).
    // The [availableHeight, 0] range is inverted because SVGs coordinate system's origin is
    // in top left corner, while chart's origin is in bottom left corner, hence we need to invert
    // the range on Y axis for the chart to display as though its origin is at bottom left.
    let y = ScaleLinear::new()
        .set_domain(vec![0_f32, 100_f32])
        .set_range(vec![height - top - bottom, 0]);

    // You can use your own iterable as data as long as its items implement the `PointDatum` trait.
    let line_data = vec![(12, 54), (100, 40), (120, 50), (180, 70)];

    // Create Line series view that is going to represent the data.
    let line_view = LineSeriesView::new()
        .set_x_scale(&x)
        .set_y_scale(&y)
        .set_marker_type(MarkerType::Circle)
        .set_label_position(PointLabelPosition::N)
        .load_data(&line_data).unwrap();

    // Generate and save the chart.
    Chart::new()
        .set_width(width)
        .set_height(height)
        .set_margins(top, right, bottom, left)
        .add_title(String::from("Line Chart"))
        .add_view(&line_view)
        .add_axis_bottom(&x)
        .add_axis_left(&y)
        .add_left_axis_label("Custom Y Axis Label")
        .add_bottom_axis_label("Custom X Axis Label")
        .save("line-chart.svg").unwrap();
}
面积系列
目前,AreaSeriesView 不支持具有多个键的数据集,因此无法显示堆叠面积图。
use charts::{Chart, ScaleLinear, MarkerType, PointLabelPosition, AreaSeriesView};

fn main() {
    // Define chart related sizes.
    let width = 800;
    let height = 600;
    let (top, right, bottom, left) = (90, 40, 50, 60);

    // Create a band scale that will interpolate values in [0, 200] to values in the
    // [0, availableWidth] range (the width of the chart without the margins).
    let x = ScaleLinear::new()
        .set_domain(vec![12_f32, 180_f32])
        .set_range(vec![0, width - left - right]);

    // Create a linear scale that will interpolate values in [0, 100] range to corresponding
    // values in [availableHeight, 0] range (the height of the chart without the margins).
    // The [availableHeight, 0] range is inverted because SVGs coordinate system's origin is
    // in top left corner, while chart's origin is in bottom left corner, hence we need to invert
    // the range on Y axis for the chart to display as though its origin is at bottom left.
    let y = ScaleLinear::new()
        .set_domain(vec![0_f32, 100_f32])
        .set_range(vec![height - top - bottom, 0]);

    // You can use your own iterable as data as long as its items implement the `PointDatum` trait.
    let area_data = vec![(12, 54), (100, 40), (120, 50), (180, 70)];

    // Create Area series view that is going to represent the data.
    let area_view = AreaSeriesView::new()
        .set_x_scale(&x)
        .set_y_scale(&y)
        .set_marker_type(MarkerType::Circle)
        .set_label_position(PointLabelPosition::N)
        .load_data(&area_data).unwrap();

    // Generate and save the chart.
    Chart::new()
        .set_width(width)
        .set_height(height)
        .set_margins(top, right, bottom, left)
        .add_title(String::from("Area Chart"))
        .add_view(&area_view)
        .add_axis_bottom(&x)
        .add_axis_left(&y)
        .add_left_axis_label("Custom Y Axis Label")
        .add_bottom_axis_label("Custom X Axis Label")
        .save("area-chart.svg").unwrap();
}
图表组成
一旦您了解了基本构建块(主要是 刻度 和 视图),那么您可以使用 charts 实现的内容就几乎是无限的(目前有可用的实现视图,:))。
主要思想是使用常见的刻度实例,这些实例作为不同数据集和视图之间的共同上下文。
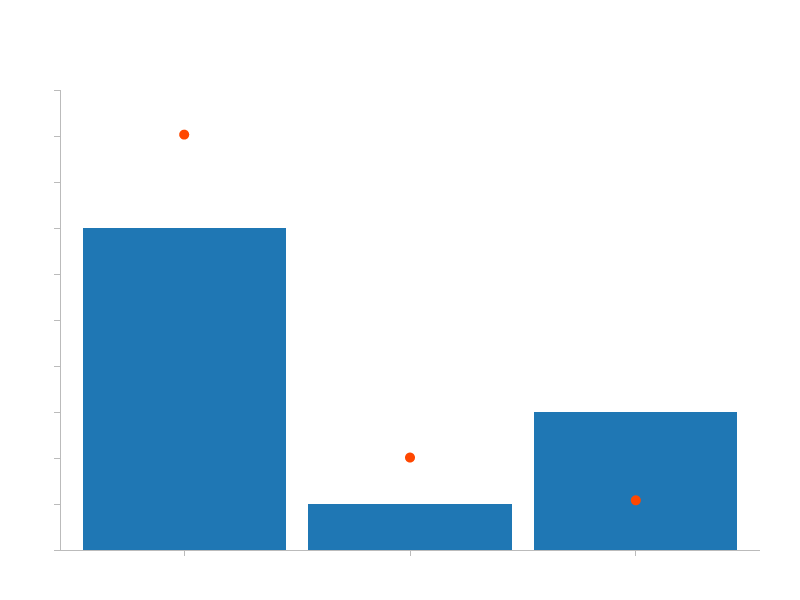
一个例子是将柱状图和散点图结合起来
use charts::{Chart, VerticalBarView, ScaleBand, ScaleLinear, ScatterView, MarkerType, Color, PointLabelPosition};

fn main() {
    // Define chart related sizes.
    let width = 800;
    let height = 600;
    let (top, right, bottom, left) = (90, 40, 50, 60);

    // Create a band scale that maps ["A", "B", "C"] categories to values in the [0, availableWidth]
    // range (the width of the chart without the margins).
    let x = ScaleBand::new()
        .set_domain(vec![String::from("A"), String::from("B"), String::from("C")])
        .set_range(vec![0, width - left - right]);

    // Create a linear scale that will interpolate values in [0, 100] range to corresponding
    // values in [availableHeight, 0] range (the height of the chart without the margins).
    // The [availableHeight, 0] range is inverted because SVGs coordinate system's origin is
    // in top left corner, while chart's origin is in bottom left corner, hence we need to invert
    // the range on Y axis for the chart to display as though its origin is at bottom left.
    let y = ScaleLinear::new()
        .set_domain(vec![0, 100])
        .set_range(vec![height - top - bottom, 0]);

    // You can use your own iterable as data as long as its items implement the `BarDatum` trait.
    let bar_data = vec![("A", 70), ("B", 10), ("C", 30)];

    // You can use your own iterable as data as long as its items implement the `PointDatum` trait.
    let scatter_data = vec![(String::from("A"), 90.3), (String::from("B"), 20.1), (String::from("C"), 10.8)];

    // Create VerticalBar view that is going to represent the data as vertical bars.
    let bar_view = VerticalBarView::new()
        .set_x_scale(&x)
        .set_y_scale(&y)
        .load_data(&bar_data).unwrap();

    // Create Scatter view that is going to represent the data as points.
    let scatter_view = ScatterView::new()
        .set_x_scale(&x)
        .set_y_scale(&y)
        .set_label_position(PointLabelPosition::NE)
        .set_marker_type(MarkerType::Circle)
        .set_colors(Color::from_vec_of_hex_strings(vec!["#FF4700"]))
        .load_data(&scatter_data).unwrap();

    // Generate and save the chart.
    Chart::new()
        .set_width(width)
        .set_height(height)
        .set_margins(top, right, bottom, left)
        .add_title(String::from("Composite Bar + Scatter Chart"))
        .add_view(&bar_view)                            // <-- add bar view
        .add_view(&scatter_view)                        // <-- add scatter view
        .add_axis_bottom(&x)
        .add_axis_left(&y)
        .add_left_axis_label("Units of Measurement")
        .add_bottom_axis_label("Categories")
        .save("composite-bar-and-scatter-chart.svg").unwrap();
}
结果如下所示
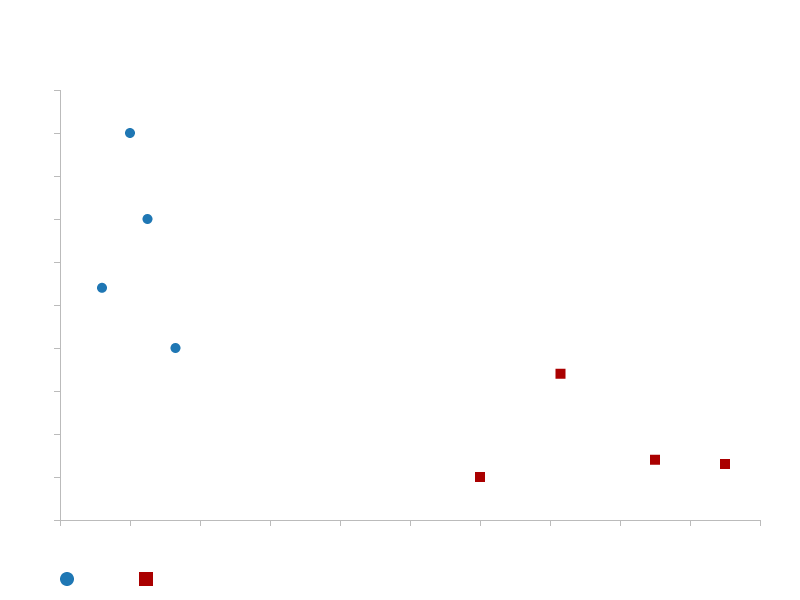
另一个例子是将不同的数据集结合起来。例如,我们可以定义覆盖两个数据集域的刻度,并查看它们之间的关系。
use charts::{Chart, ScaleLinear, ScatterView, MarkerType, PointLabelPosition, Color, AxisPosition};

fn main() {
    // Define chart related sizes.
    let width = 800;
    let height = 600;
    let (top, right, bottom, left) = (90, 40, 80, 60);

    // Create a band scale that will interpolate values in [0, 200] to values in the
    // [0, availableWidth] range (the width of the chart without the margins).
    let x = ScaleLinear::new()
        .set_domain(vec![0_f32, 200_f32])
        .set_range(vec![0, width - left - right]);

    // Create a linear scale that will interpolate values in [0, 100] range to corresponding
    // values in [availableHeight, 0] range (the height of the chart without the margins).
    // The [availableHeight, 0] range is inverted because SVGs coordinate system's origin is
    // in top left corner, while chart's origin is in bottom left corner, hence we need to invert
    // the range on Y axis for the chart to display as though its origin is at bottom left.
    let y = ScaleLinear::new()
        .set_domain(vec![0_f32, 100_f32])
        .set_range(vec![height - top - bottom, 0]);

    // You can use your own iterable as data as long as its items implement the `PointDatum` trait.
    let scatter_data_1 = vec![(20, 90), (12, 54), (25, 70), (33, 40)];
    let scatter_data_2 = vec![(120, 10), (143, 34), (170, 14), (190, 13)];

    // Create Scatter view that is going to represent the data as points.
    let scatter_view_1 = ScatterView::new()
        .set_x_scale(&x)
        .set_y_scale(&y)
        .set_marker_type(MarkerType::Circle)
        .set_label_position(PointLabelPosition::N)
        .set_custom_data_label("Apples".to_owned())
        .load_data(&scatter_data_1).unwrap();

    // Create Scatter view that is going to represent the data as points.
    let scatter_view_2 = ScatterView::new()
        .set_x_scale(&x)
        .set_y_scale(&y)
        .set_marker_type(MarkerType::Square)
        .set_label_position(PointLabelPosition::N)
        .set_custom_data_label("Oranges".to_owned())
        .set_colors(Color::from_vec_of_hex_strings(vec!["#aa0000"]))
        .load_data(&scatter_data_2).unwrap();

    // Generate and save the chart.
    Chart::new()
        .set_width(width)
        .set_height(height)
        .set_margins(top, right, bottom, left)
        .add_title(String::from("Scatter Chart"))
        .add_view(&scatter_view_1)
        .add_view(&scatter_view_2)
        .add_axis_bottom(&x)
        .add_axis_left(&y)
        .add_left_axis_label("Custom X Axis Label")
        .add_bottom_axis_label("Custom Y Axis Label")
        .add_legend_at(AxisPosition::Bottom)
        .save("scatter-chart-two-datasets.svg").unwrap();
}
下一步
这仍然是一个正在进行中的项目,所以下一步将是实现更多的视图和改进现有功能。
依赖项
~2.3–3.5MB
~56K SLoC
