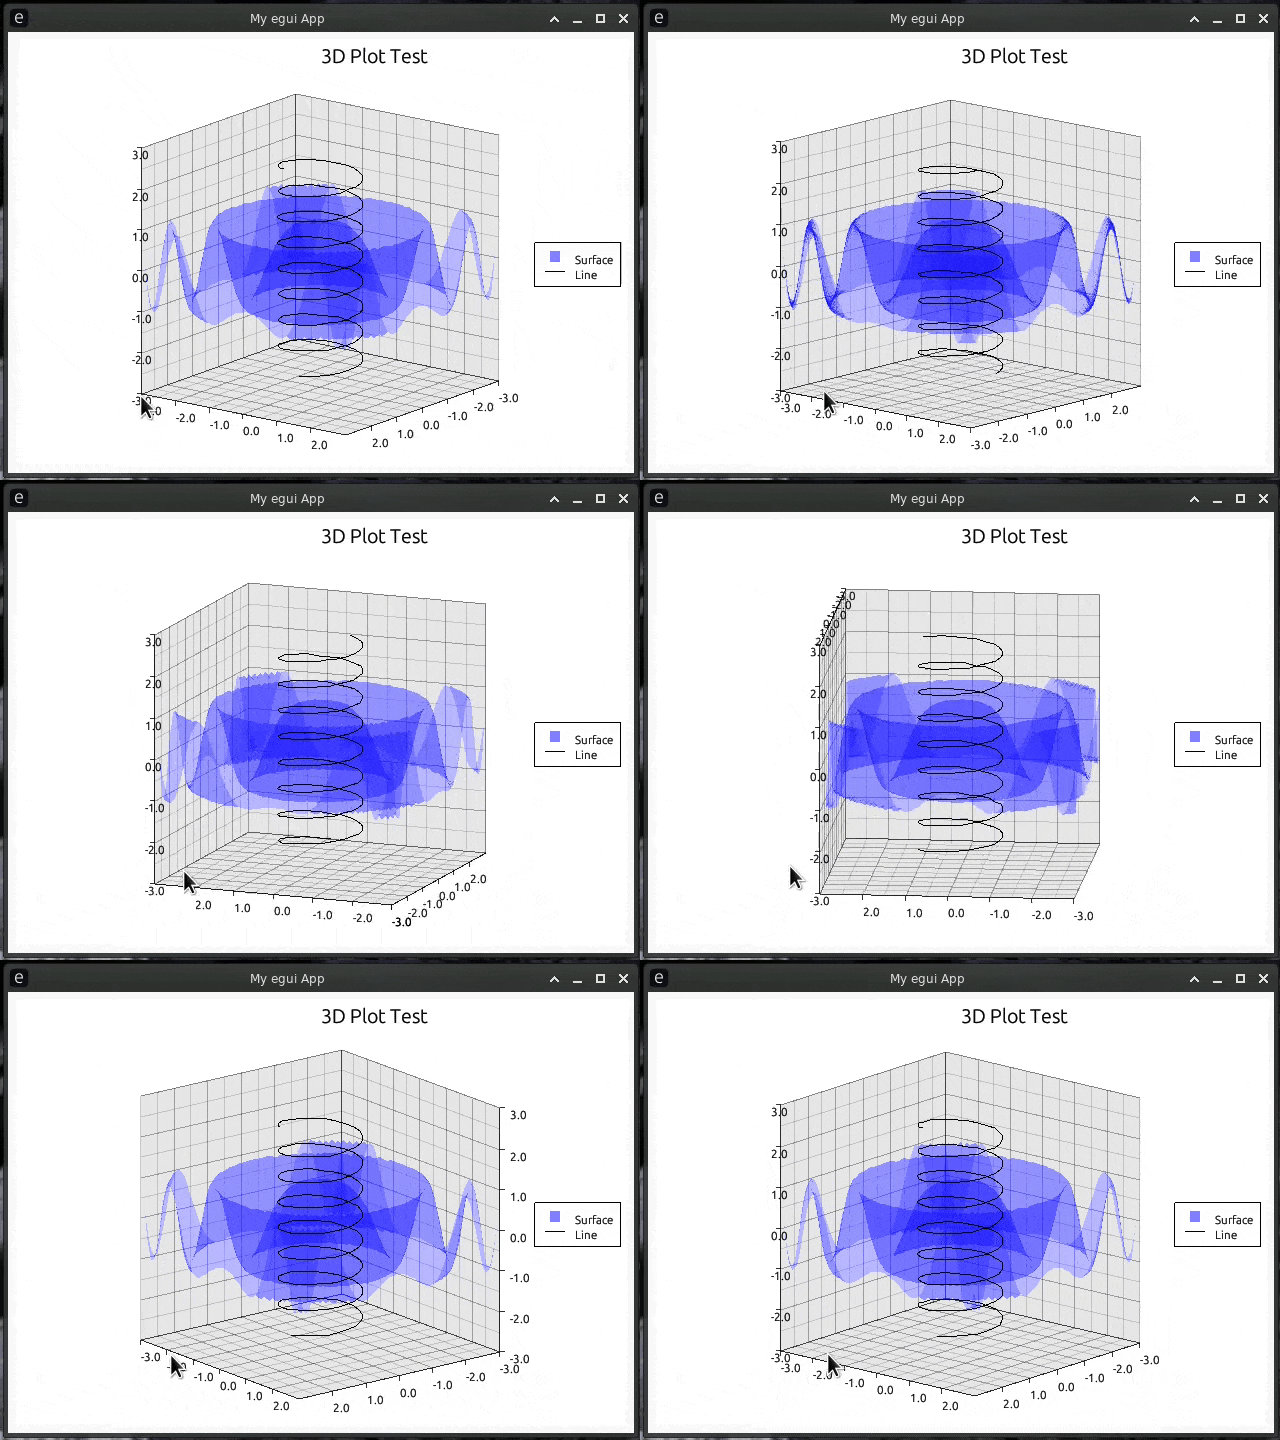
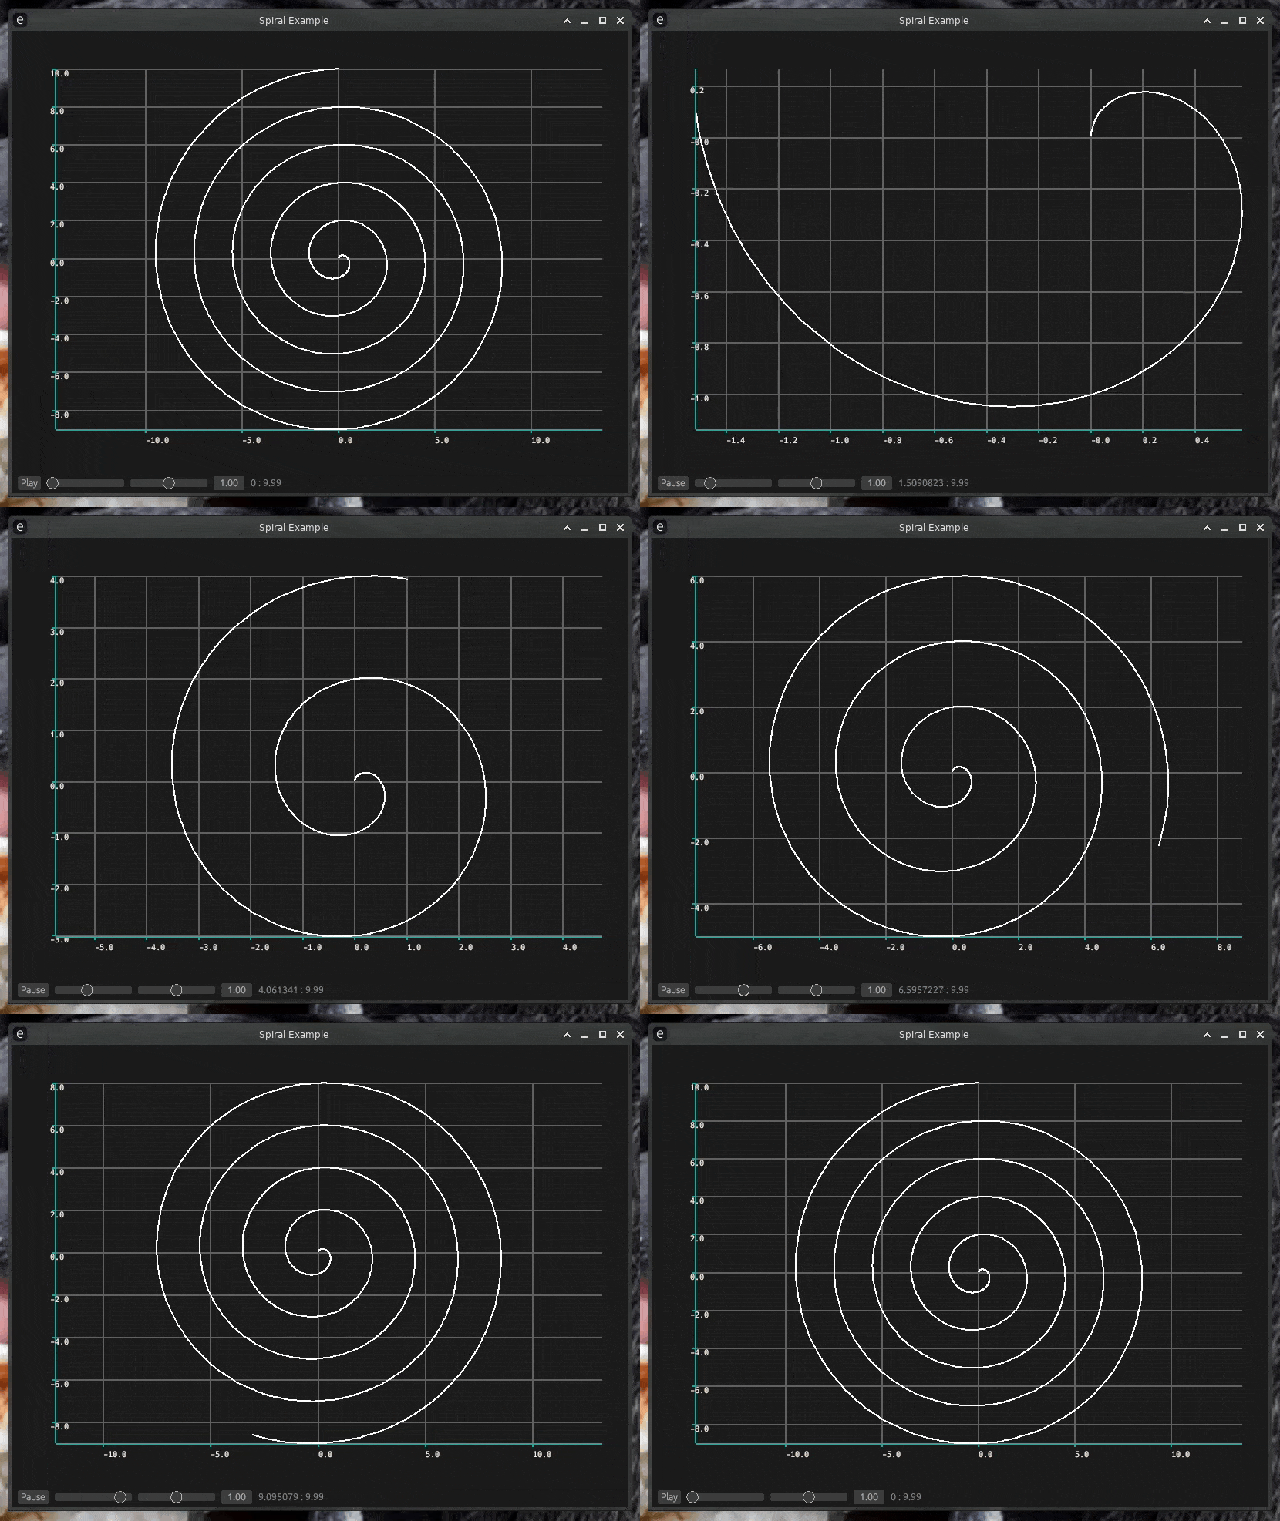
5个不稳定版本
| 0.3.0 | 2023年6月25日 |
|---|---|
| 0.2.1 | 2023年6月18日 |
| 0.2.0 | 2023年6月15日 |
| 0.1.1 | 2023年6月12日 |
| 0.1.0 | 2023年6月11日 |
#193 in 可视化
62KB
1K SLoC
egui-plotter
简单易用的实用工具,用于将绘图器集成到egui
用法
可以通过将 egui-plotter 添加到项目 Cargo.toml 中的依赖项来使用此包。
[dependencies]
egui-plotter = "0.3.0"
强烈建议在egui上下文中禁用羽化,因为它不仅会减慢速度,还会导致某些绘图出现伪影。
以下为禁用羽化的示例代码第24行。
示例
这是一个在原生eframe上运行的简单绘图器示例。它由 eframe 和 plotters 派生而来。
use eframe::egui::{self, CentralPanel, Visuals};
use egui_plotter::EguiBackend;
use plotters::prelude::*;

fn main() {
    let native_options = eframe::NativeOptions::default();
    eframe::run_native(
        "Simple Example",
        native_options,
        Box::new(|cc| Box::new(Simple::new(cc))),
    )
    .unwrap();
}

#[derive(Default)]
struct Simple {}

impl Simple {
    fn new(cc: &eframe::CreationContext<'_>) -> Self {
        // Disable feathering as it causes artifacts
        let context = &cc.egui_ctx;

        context.tessellation_options_mut(|tess_options| {
            tess_options.feathering = false;
        });

        // Also enable light mode
        context.set_visuals(Visuals::light());

        Self::default()
    }
}

impl eframe::App for Simple {
    fn update(&mut self, ctx: &egui::Context, _frame: &mut eframe::Frame) {
        CentralPanel::default().show(ctx, |ui| {
            let root = EguiBackend::new(ui).into_drawing_area();
            root.fill(&WHITE).unwrap();
            let mut chart = ChartBuilder::on(&root)
                .caption("y=x^2", ("sans-serif", 50).into_font())
                .margin(5)
                .x_label_area_size(30)
                .y_label_area_size(30)
                .build_cartesian_2d(-1f32..1f32, -0.1f32..1f32)
                .unwrap();

            chart.configure_mesh().draw().unwrap();

            chart
                .draw_series(LineSeries::new(
                    (-50..=50).map(|x| x as f32 / 50.0).map(|x| (x, x * x)),
                    &RED,
                ))
                .unwrap()
                .label("y = x^2")
                .legend(|(x, y)| PathElement::new(vec![(x, y), (x + 20, y)], &RED));

            chart
                .configure_series_labels()
                .background_style(&WHITE.mix(0.8))
                .border_style(&BLACK)
                .draw()
                .unwrap();

            root.present().unwrap();
        });
    }
}
图表
或者,上述示例可以使用 Chart 类型来实现,以便用户可以轻松与绘图器图表进行交互。您可以选择自己创建图表或使用 charts 模块中包含的预构建图表类型。
use eframe::egui::{self, CentralPanel, Visuals};
use egui::Key;
use egui_plotter::{Chart, MouseConfig};
use plotters::prelude::*;
use std::ops::Range;

fn main() {
    let native_options = eframe::NativeOptions::default();
    eframe::run_native(
        "ParaChart Example",
        native_options,
        Box::new(|cc| Box::new(ParaChart::new(cc))),
    )
    .unwrap();
}

struct ParaChart {
    chart: Chart,
}

impl ParaChart {
    fn new(cc: &eframe::CreationContext<'_>) -> Self {
        // Disable feathering as it causes artifacts
        let context = &cc.egui_ctx;

        context.tessellation_options_mut(|tess_options| {
            tess_options.feathering = false;
        });

        // Also enable light mode
        context.set_visuals(Visuals::light());

        // We use data to adjust the range of the chart. This can be useful for
        // line plots where the X represents time and we want to play through
        // the X, but that is not what we are using it for here
        let chart = Chart::new()
            .mouse(MouseConfig::enabled())
            .data(Box::new((-3f32..3f32, -0.5f32..3f32)))
            .builder_cb(Box::new(|area, _t, ranges| {
                // Build a chart like you would in any other plotter chart.
                // The drawing area and ranges are provided by the callback,
                // but otherwise everything else is the same.
                let ranges: &(Range<f32>, Range<f32>) =
                    ranges.as_ref().unwrap().downcast_ref().unwrap();

                let (x_range, y_range) = ranges;

                let mut chart = ChartBuilder::on(area)
                    .caption("y=x^2", ("sans-serif", 50).into_font())
                    .margin(5)
                    .x_label_area_size(30)
                    .y_label_area_size(30)
                    .build_cartesian_2d(x_range.to_owned(), y_range.to_owned())
                    .unwrap();

                chart.configure_mesh().draw().unwrap();

                chart
                    .draw_series(LineSeries::new(
                        (-50 * (x_range.end as i32)..=(50 * x_range.end as i32))
                            .map(|x| x as f32 / 50.0)
                            .map(|x| (x, x * x)),
                        &RED,
                    ))
                    .unwrap()
                    .label("y = x^2")
                    .legend(|(x, y)| PathElement::new(vec![(x, y), (x + 20, y)], &RED));

                chart
                    .configure_series_labels()
                    .background_style(&WHITE.mix(0.8))
                    .border_style(&BLACK)
                    .draw()
                    .unwrap();
            }));

        Self { chart }
    }
}

impl eframe::App for ParaChart {
    fn update(&mut self, ctx: &egui::Context, _frame: &mut eframe::Frame) {
        CentralPanel::default().show(ctx, |ui| {
            // Press 1 for the range -1..1, 2 for -2..2, 3 for -3..3
            ui.input(|input| {
                if input.key_down(Key::Num1) {
                    self.chart.set_data(Box::new((-1f32..1f32, -0.5f32..1f32)));
                }
                if input.key_down(Key::Num2) {
                    self.chart.set_data(Box::new((-2f32..2f32, -0.5f32..2f32)));
                }

                if input.key_down(Key::Num3) {
                    self.chart.set_data(Box::new((-3f32..3f32, -0.5f32..3f32)));
                }
            });

            self.chart.draw(ui);
        });
    }
}
依赖项
~16–24MB
~175K SLoC

