1 个不稳定版本
使用旧的 Rust 2015
| 0.0.9 | 2018年2月15日 |
|---|
#241 in 可视化
225KB
2K SLoC
Astrup
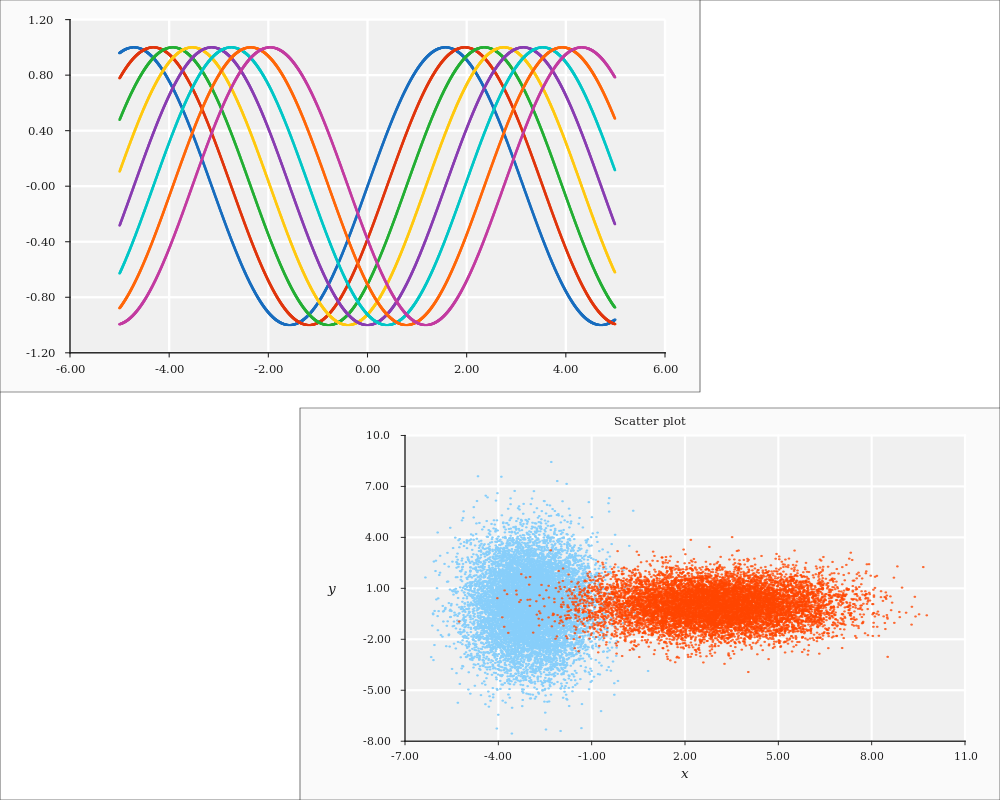
Astrup 是一个使用 gtk-rs 作为后端的 Rust 绘图库。这仍然是一个非常小的个人项目。我相信它可以用于简单的用途,但应该预期会有很多变化(包括破坏性的变化)。
有关其他 Rust 绘图库,请参阅例如:
构建
- 安装 rust,并确保
~/.cargo/bin/在您的PATH中。 - 确保您的系统上安装了 GTK+、GLib 和 Cairo 开发文件。安装说明可在此处找到 here。
- 克隆存储库,并使用
cargo build构建。
全局
- 从多个容器(优先级:
Vec和ndarray)中绘制数据。 - 构建图表应该是直观的。
- 图表应该看起来很漂亮,并且具有信息性。
- 它应该非常可配置。
计划中的图表
下表按优先级列出了计划中的图表变体。目前,仅实现了简单的散点图和折线图。
| 变体 | 已实现 |
|---|---|
| 散点图 | 部分实现 |
| 折线图 | 部分实现 |
| 直方图 | 无 |
| 矩阵热图 | 无 |
| 图像 | 无 |
| 填充曲线 | 无 |
| 箱线图 | 无 |
| 饼图 | 无 |
示例
extern crate ndarray;
extern crate rand;
extern crate astrup;

use std::f64::consts::PI;

use ndarray::Array;
use rand::distributions::{IndependentSample, Normal};
use rand::{thread_rng};

use astrup::view::View;
use astrup::figure::Figure;
use astrup::plot::Plot;
use astrup::chart::Chart;
use astrup::chart::scatter::Scatter;
use astrup::chart::line::Line;

fn main() {

    // Create data contained in ndarray
    let x_data = Array::from_iter((0..100).map(|x| (x as f64) * 2.0 * PI / 100.0));
    let y_data1 = Array::from_iter((0..100).map(|i| x_data[i].sin()));
    let y_data2 = Array::from_iter((0..100).map(|i| (x_data[i] - PI / 2.0).sin()));

    // Plot lines
    let line1 = Line::new(&x_data, &y_data1).set_stroke_style("dotted");
    let line2 = Line::new(&x_data, &y_data2).set_color_rgba(0.9, 0.2, 0.2, 0.9);

    // Add lines to a plot
    let line_plot = Plot::new().add(Chart::Line(line1))
                               .add(Chart::Line(line2))
                               .set_y_min(-1.2)
                               .set_local_frame(0.0, 0.7, 0.51, 1.0);

    // Create scatter points
    let normal_0_1 = Normal::new(0.0, 1.0);
    let normal_0_2 = Normal::new(0.0, 2.0);
    let x_data: Vec<f64> = (0..1000)
                           .map(|_| normal_0_1.ind_sample(&mut thread_rng()))
                           .collect();
    let y_data: Vec<f64> = (0..1000)
                           .map(|_| normal_0_2.ind_sample(&mut thread_rng()))
                           .collect();
    let scatter = Scatter::new(&x_data, &y_data).set_color_rgba(0.1, 0.8, 0.3, 0.9)
                                                .set_point_size(0.005);

    // Add scatter points to a new plot
    let scatter_plot = Plot::new().set_local_frame(0.3, 1.0, 0.0, 0.49)
                                  .add(Chart::Scatter(scatter));

    // Add the plots to a figure, and save it
    let fig = Figure::new().add(line_plot)
                           .add(scatter_plot)
                           .set_width(1000)
                           .set_height(800)
                           .set_border_thickness(0.001)
                           .save("assets/frontpage_example.png").expect("Could not save frontpage_example.png");

    // Display the result on screen
    View::new_from(fig).expect("Could not add figure to view")
                       .show();
}

依赖项
~20MB
~448K SLoC