1 个不稳定版本
| 0.1.0 | 2022 年 1 月 2 日 |
|---|
#936 在 科学
1,724 每月下载量
在 9 个 crates (4 直接) 中使用
60KB
330 代码行
使用 Welch 方法进行谱密度和功率谱估计
Welch 方法用于估计平稳且零均值的信号的周期图,涉及将信号分割成重叠段,将每个段与预定窗口相乘,并计算每个窗口段的离散傅里叶变换。周期图由每个傅里叶变换的平方幅度平均值给出。只返回与正频率相对应的功率谱的一半,两部分在零频率处对称。
从周期图可以导出 谱密度 或 功率谱。两者在周期图的缩放方面有所不同。对于 谱密度,周期图除以采样频率与窗口样本平方和的乘积。对于 功率谱,周期图除以窗口样本平方和的平方。
示例
功率谱
use rand::prelude::*;
use rand_distr::StandardNormal;
use std::time::Instant;
use welch_sde::{Build, PowerSpectrum};

fn main() {
    let n = 1e6 as usize;
    let signal: Vec<f64> = (0..n)
        .map(|_| 1.234_f64.sqrt() * thread_rng().sample::<f64, StandardNormal>(StandardNormal))
        .collect();
    {
        let mean = signal.iter().cloned().sum::<f64>() / n as f64;
        let variance = signal.iter().map(|s| *s - mean).map(|x| x * x).sum::<f64>() / n as f64;
        println!("Signal variance: {:.3}", variance);
    }

    let welch: PowerSpectrum<f64> = PowerSpectrum::builder(&signal).build();
    println!("{}", welch);

    let now = Instant::now();
    let ps = welch.periodogram();
    println!(
        "Power spectrum estimated in {}ms",
        now.elapsed().as_millis()
    );
    {
        let variance = 2. * ps.iter().sum::<f64>();
        println!("Signal variance from power spectrum: {:.3}", variance);
    }
}
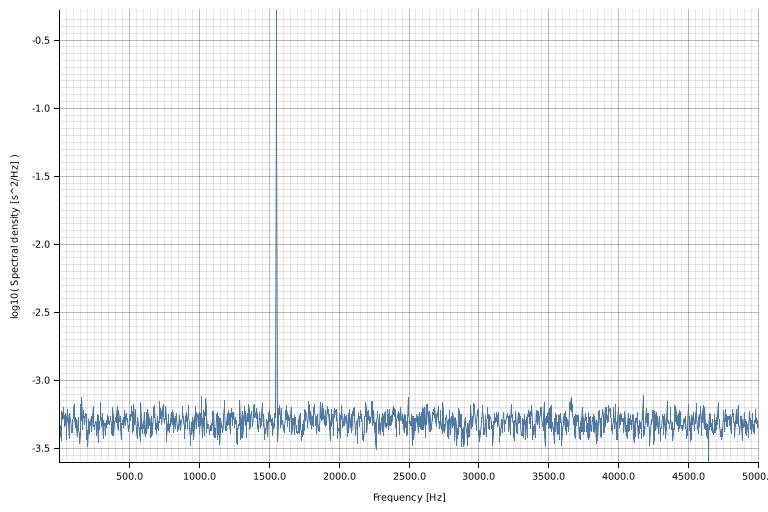
谱密度
use rand::prelude::*;
use rand_distr::StandardNormal;
use std::time::Instant;
use welch_sde::{SpectralDensity, Build};

fn main() {
    let n = 1e5 as usize;
    let fs = 10e3_f64;
    let amp = 2. * 2f64.sqrt();
    let freq = 1550f64;
    let noise_power = 0.001 * fs / 2.;
    let sigma = noise_power.sqrt();
    let signal: Vec<f64> = (0..n)
        .map(|i| i as f64 / fs)
        .map(|t| {
            amp * (2. * std::f64::consts::PI * freq * t).sin()
                + thread_rng().sample::<f64, StandardNormal>(StandardNormal) * sigma
        })
        .collect();

    let welch: SpectralDensity<f64> =
        SpectralDensity::<f64>::builder(&signal, fs).build();
    println!("{}", welch);
    let now = Instant::now();
    let sd = welch.periodogram();
    println!(
        "Spectral density estimated in {}ms",
        now.elapsed().as_millis()
    );
    let noise_floor = sd.iter().cloned().sum::<f64>() / sd.len() as f64;
    println!("Noise floor: {:.3}", noise_floor);

    let _: complot::LinLog = (
        sd.frequency()
            .into_iter()
            .zip(&(*sd))
            .map(|(x, &y)| (x, vec![y])),
        complot::complot!(
            "spectral_density.png",
            xlabel = "Frequency [Hz]",
            ylabel = "Spectral density [s^2/Hz]"
        ),
    )
        .into();
}

依赖项
~3MB
~57K SLoC