5 个版本
| 0.1.3 | 2020年5月7日 |
|---|---|
| 0.1.2 | 2020年5月6日 |
| 0.1.1 | 2020年5月5日 |
| 0.1.0 | 2020年4月4日 |
#261 in 性能分析
每月 27 下载
10KB
210 行
Readings 的目的是获取进程健康状态的关键信息。
它由两个 crate 组成
- readings-probe 是必须依赖和设置的仪表部分
- readings 包含将仪表输出制作成图表的可执行文件
我正在尝试让它变得容易获取我在几年前博客系列中使用的图形:[链接](http://www.poumeyrol.fr/2016/02/08/Hashes-to-hashes/)。Readings 还没有实现,但愿望在这里。
状态
这是 alpha,早期的 bazaar 风格的工作。例如,探针代码只在 Linux、Mac 和 Windows 上编译。Windows 上只有来自 OS 的 CPU 仪表(需要 Win32 高手的帮助进行故障和内存使用 :))。
快速入门
仪表
Cargo.toml
[dependencies]
readings-probe = "0.1"
在你的主函数中,或者附近
// this is optional but the cost may be worth it. YMMV
readings_probe::instrumented_allocator!();

fn main() -> readings_probe::ReadingsResult<()> {
    // setup the probe
    let mut probe =
        readings_probe::Probe::new(std::fs::File::create("readings.out").unwrap()).unwrap();

    // We will use an AtomicI64 to communicate a user-defined metric ("progress") to the probe.
    let progress = probe.register_i64("progress".to_string())?;

    // Starts the probe (1sec is a lot. The heartbeat can be realistically set as low as a few millis).
    probe.spawn_heartbeat(std::time::Duration::from_millis(1000))?;

    // do some stuff, update progress
    progress.store(percent_done, std::sync::atomic::Ordering::Relaxed);

    // do more stuff, log an event
    probe.log_event("about to get crazy")?;

    // still more stuff, and another event
    probe.log_event("done")?;
    Ok(())
}
图表
- 安装命令行工具。
cargo安装 readings
readings--帮助
Readings library plotter

USAGE:
    readings [FLAGS] [OPTIONS] <INPUT>

FLAGS:
        --single-core    Show CPU assuming single thread
    -h, --help           Prints help information
    -V, --version        Prints version information

OPTIONS:
    -f, --from <FROM>    Timestamp (seconds) or event label to start from
    -t, --to <TO>        Timestamp (secodns) or event label to stop at.

ARGS:
    <INPUT>    Sets the input file to plot
- 运行它
运行 readings readings.out 并打开 readings.out.png。
示例

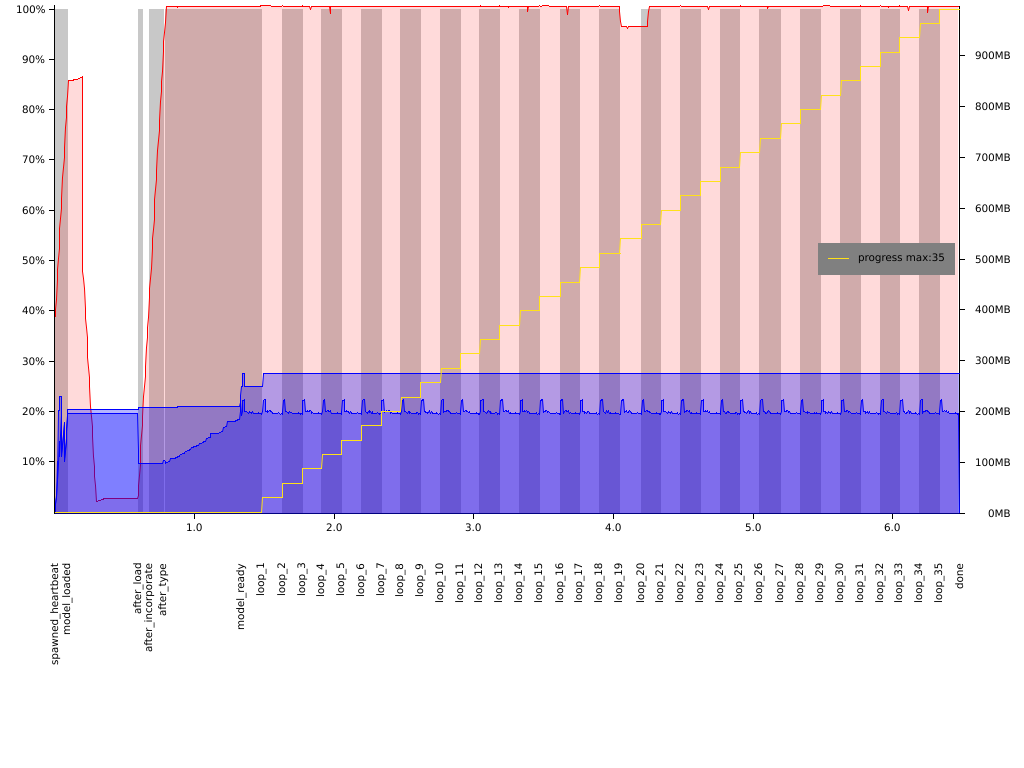
这是一个使用 tract 加载大型神经网络模型并在循环中评估的极其漂亮的示例。
我们知道它并不完全美观... 但这只是 0.1!我们会变得更好。同时,这里有一些提示
- 红色曲线(和面积)表示 CPU 使用率。在这里,100% 表示单个核心饱和(因为我们以
--single-core运行图形绘制器)。 - 两条蓝色线都表示内存使用率。下面一条是 rust 全局分配器仪表,上面一条是 OS 报告的 RSS。你可以注意到全局分配器探针比 RSS 探针更有用...
- 黄色楼梯是用户定义的指标:在 tract 中我们定义了一个来计算神经网络评估的循环次数
- 背景灰色条纹表示事件:每次调用
log_event时,它会从灰色切换到白色。事件标签写在下方。 - 内存图显然是通过右侧坐标轴索引的。其余部分均为百分比:%cpu,或用户定义探针达到的最大值的百分比。
许可证
Apache 2.0/MIT
所有原始作品均根据以下其中之一获得许可:
- Apache许可证第2版 (LICENSE-APACHE 或 https://apache.ac.cn/licenses/LICENSE-2.0)
- MIT许可证 (LICENSE-MIT 或 https://open-source.org.cn/licenses/MIT),由您选择。
贡献
除非您明确声明,否则根据Apache-2.0许可证定义,您有意提交以包含在作品中的任何贡献,都将如上所述双重许可,不附加任何额外条款或条件。
依赖项
~1.9–3.5MB
~62K SLoC