1个不稳定版本
| 0.1.0 | 2024年8月14日 |
|---|
#31 在 可视化
每月119 次下载
1MB
312 行
vega view
使用Vega Lite在webview中显示nushell表格。
构建
这是一个Rust项目,所以需要升级Rust!支持脚本需要nushell,在此安装。接下来,下载Vega必需品
nu download-vega.nu
现在可以构建可执行文件vega-view
cargo build --release
要运行vega-view,必须有一个webview组件。您可能已经作为您平台的一部分安装了它,但请检查wry项目的平台特定说明。(该项目使用wry。)
用法
首先运行nu然后
use vega.nu                           # load the vega nushell module.
vega view <title> <spec>              # visualize the input with a given title and vega-lite specification
vega bar {flags} <value>              # generate a specification for a bar graph
vega series {flags} <value> <time>    # generate a specification for a time series plot
vega scatter {flags} <value> <domain> # generate a specification for a scatter plot
vega flip                             # exchange the x and y axes of a specification
例如,以下nushell脚本将可视化example.json中的表格的b列
use vega.nu
let spec = vega bar b
let data = open example.json
$data | vega view $spec
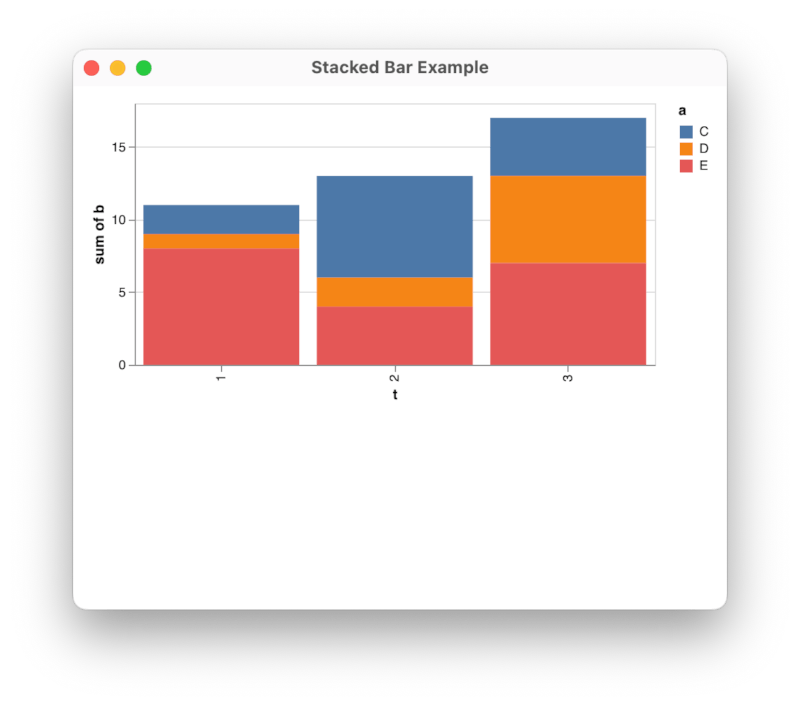
这生成一个条形图,其高度代表数据中b列的总和。一个更有趣的条形图会将数据分成几个类别。通过将类别字段标识出来并将其作为一行输入
open example.json | vega view (vega bar b --category=t --subcategory=a)
利用nushell出色的数据处理能力,您可以同样容易地可视化CSV、SQLite、JSON和其他数据源。您可以编写自己的规范或使用以下内置之一。
条形图
条形图的Vega Lite规范。
用法
> bar {flags} <value>
标志
  --category <String> - field to discriminate different bars
  --subcategory <String> - field to discriminate stacked bar sections
  --aggregate <String> - how to combine values for a bar or bar section (default: 'sum')
参数
value <string>: field name for the bar height
示例
open example.json | vega view --title "Stacked Bar Example" (vega bar b --category=t --subcategory=a)
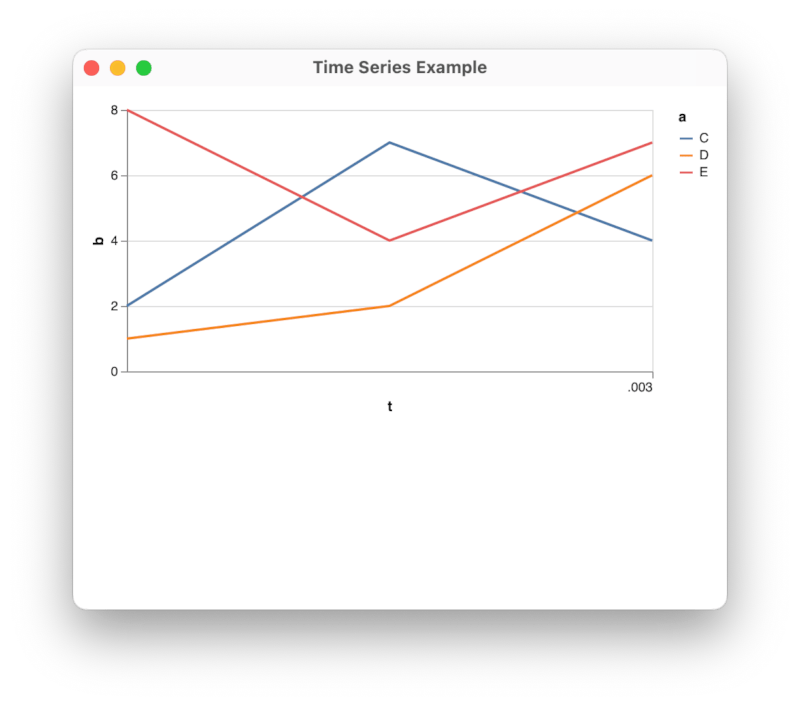
时间序列图
时间序列图的Vega Lite规范。
用法
> series {flags} <value> <time>
标志
  --category <String> - field to discriminate different series
  --area - render as a stacked area plot
参数
  value <string>: field name for the series values
  time <string>: field for time values
示例
open example.json | vega view --title "Time Series Example" (vega series b t --category a)
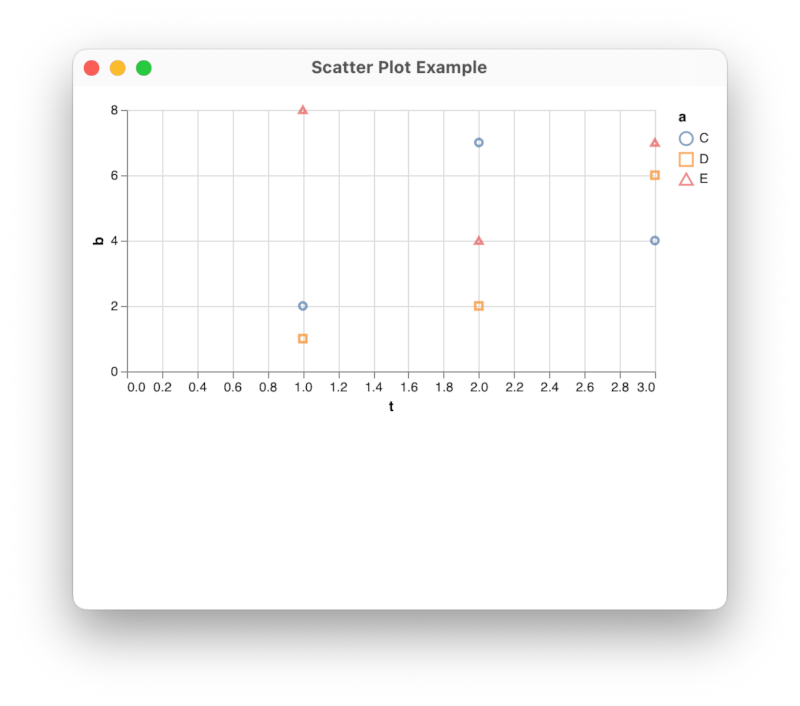
散点图
散点图的Vega Lite规范。
用法
> scatter {flags} <value> <domain>
标志
--category <String> - field for the category of the point in the plot
参数
  value <string>: field name for the y coodinate of a point in the  plot
  domain <string>: field for the x coodinate of a point in the plot
示例
open example.json | vega view --title "Scatter Plot Example" (vega scatter b t --category a)
编写规范
当开发可视化时,vega-lite图库是一个好起点。您可以通过更改字段名称以匹配您的数据来修改这些规范之一。您可以省略规范的data部分。
查看选项
vega view nushell 命令接受多个选项,用于控制如何在窗口中显示输入数据的 Vega 可视化。(我们已经在上面的示例中看到了 --title 选项。)
用法
> view {flags} <spec>
标志
  --title <String> - title for the window (default: 'Vega View')
  --width <Number> - width of the window (default: 1000)
  --height <Number> - height of the window (default: 800)
  -h, --help - Display the help message for this command
参数
spec <record>: a vega-lite specification
vega-view 可执行文件
vega-view 可执行文件创建并控制 webview。vega view nushell 命令包装该可执行文件,并处理从 nushell 表的转换。包装器通过环境变量 $env.vega_view_bin 定位可执行文件。
可以在没有 nushell 脚本的情况下直接使用 vega-view。默认情况下,JSON 数据通过标准输入提供,并以 JSON vega-lite 规范作为参数。确保规范中的数据 URL 是 /data。即
{
  ...
  data: { url: '/data' },
  ...
}
完整的命令是
Usage: vega-view [OPTIONS] <SPEC>

Arguments:
  <SPEC>  vega-lite specification for this visualization

Options:
      --page <PAGE>      file containing a HTML template for the page
      --script <SCRIPT>  file containing javascript used in the page
      --data <DATA>      file containing data to visualize (default is stdin)
      --title <TITLE>    The window title
      --width <WIDTH>    The window width
      --height <HEIGHT>  The window height
  -h, --help             Print help
许可证
包括 vega-all.js 在内的 Vega 项目材料版权所有(c)2024,华盛顿大学交互式数据实验室。见 VEGA-LICENSE。
所有其他材料版权所有(c)2024 Cuprous Pty Ltd 澳大利亚。见 LICENSE。
依赖关系
~6–42MB
~596K SLoC